Figure 1.

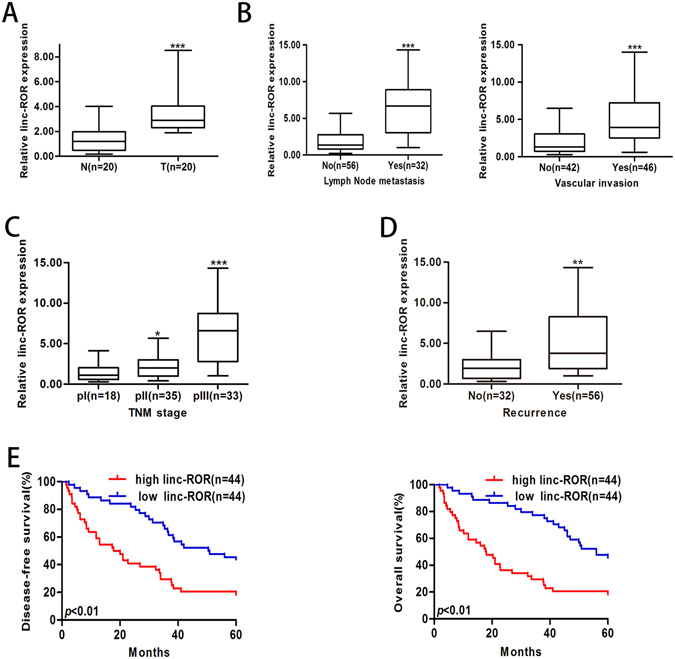
Increased linc-ROR correlates with HCC progression. Expression of linc-ROR was determined by qRT-PCR. GAPDH was used as an endogenous control. (A) Relative linc-ROR expression in HCC and paired adjacent nontumor liver tissues. T: HCC tissues; N: nontumor liver tissues. (B) Relative linc-ROR expression in HCC tissues with or without LNM and HCC tissues with or without vascular invasion. (C) Relative linc-ROR expression in HCC tissues with different TNM stage. (D) Relative linc-ROR expression in HCC tissues with or without recurrence. (E) Kaplan-Meier analysis of DFS or OS of HCC patients. Patients were grouped according to ROR expression in HCC tissues. The median expression level was used as the cutoff. Each experiment was performed at least three times. *p < 0.05, **p < 0.01 and ***p < 0.001.
