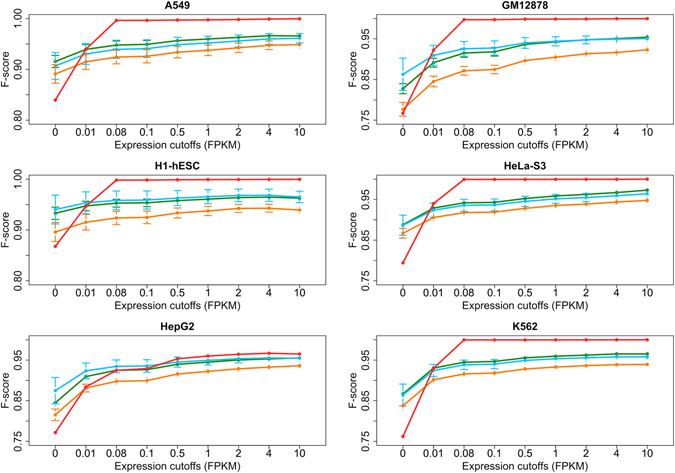
Figure 1.

-Scores after applying FPKM expression cutoffs in each gold standard dataset. Comparison of -scores after applying lower expression cutoffs in all six gold standard datasets of our predictions (red line), F-Seq (blue line), MACS (orange line) and Hotspot (green line). Dots, exemplifying mean values, and confidence intervals are shown, representing -scores across replicates and FDR (z-score) cutoffs. Only genes that are more expressed than the cutoff were taken into account for the calculation of -scores (0 cutoff representing all genes). While our method shows on average 0.075 lower scores for the whole dataset, the performance increases when only non-expressed genes are omitted and gradually increases to 0.99 in all cases except HepG2.
