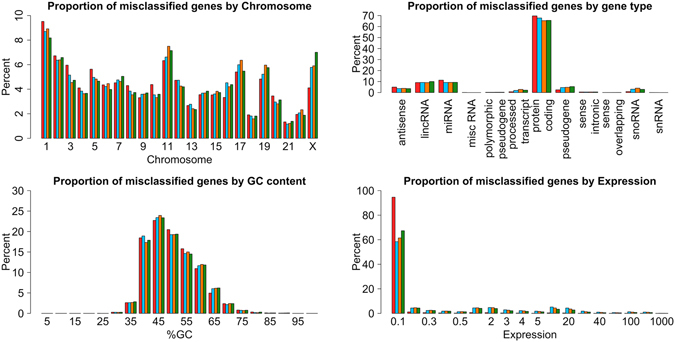
Figure 2.

Comparison of our method to peak callers with respect to potential sources of bias. Potentially influencing factors for our predictions (red bars) where compared against F-Seq (blue bars), MACS (orange bars) and Hotspot (green bars). Neither, the chromosomal location nor gene type nor the GC content of misclassified genes distinguishes predictions from observations. However, by predicting accessibility based on gene expression (bottom right histogram), we significantly reduce the number of misclassified genes in regions expressed above 0.1 FPKM (6% compared to 41.6%, 38.6% and 37.2%). Due to the deterministic prediction, genes with no expression are overrepresented in the range of 0 to 0.1 FPKM (first bar, 38% out of 94%).
