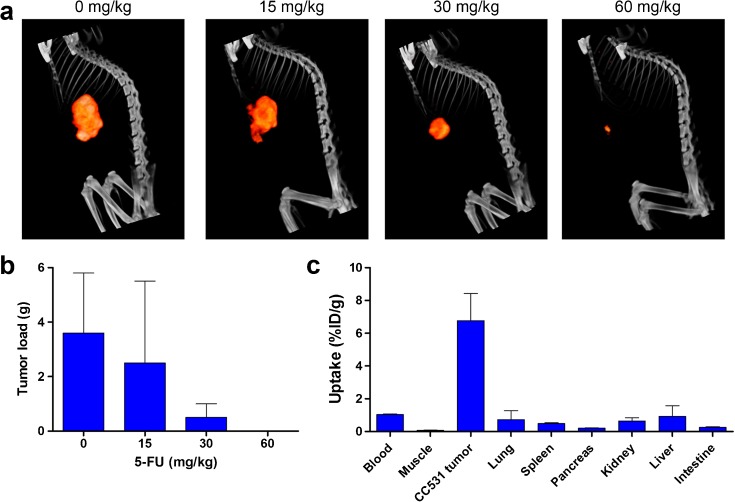
Fig. 2.
a Representative SPECT/CT images of rats with CC531 tumors, acquired at day 19 after start of 5-FU treatment. b CC531 tumor load after four cycles of 5-FU treatment as measured after dissection of the tumors presented as mean ± SD (n = 5 per group). c Biodistribution of [111In]MG1 after dissection presented as mean ± SD (n = 5 per group).

