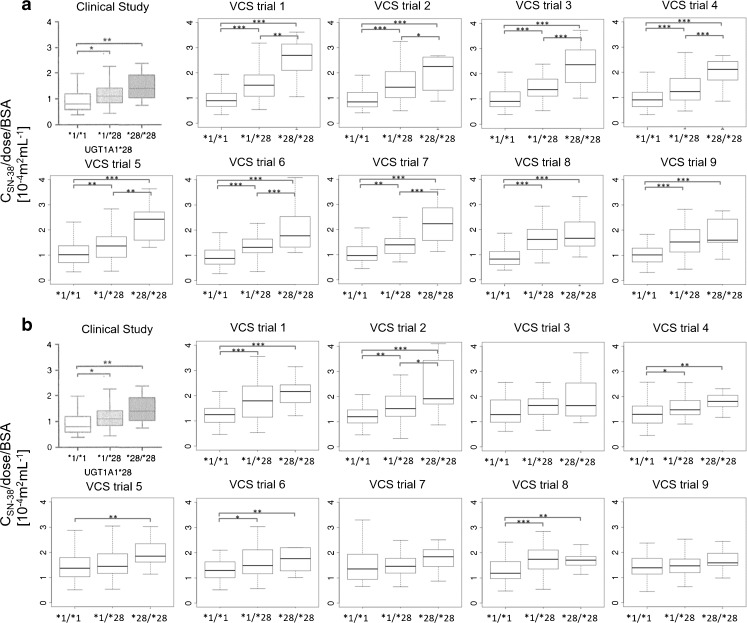
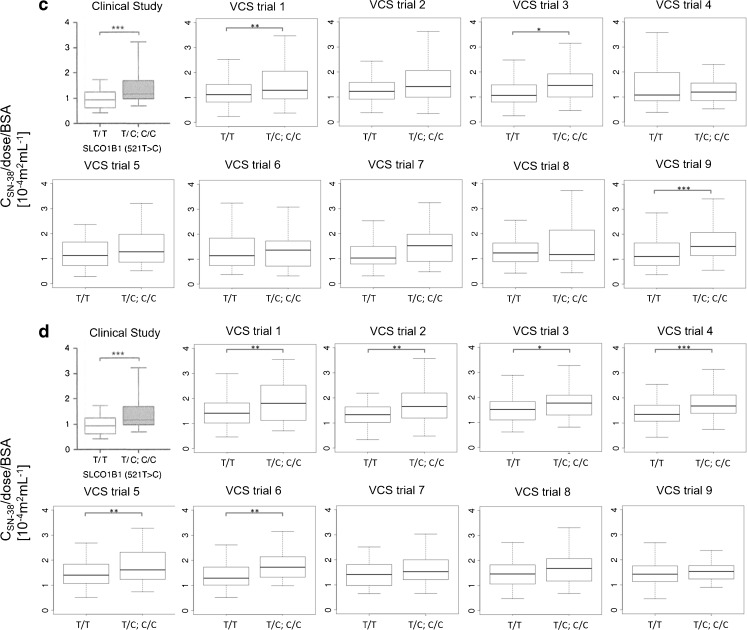
Fig. 5.
The association between the UGT1A1 *28 or SLCO1B1 c.521T>C polymorphism and dose-normalized SN-38 plasma concentration at the end of infusion (90 min) with 9 VCSs of 100 times of VCSs. (a) and (a) show the association between the UGT1A1 *28 polymorphism and dose-normalized SN-38 plasma concentration. (c) and (d) show the association between the SLCO1B1 c.521T>C polymorphism and dose-normalized SN-38 plasma concentration. In (a) and (c), each virtual patient was generated from the set of parameters ID 1. In (b) and (d), each virtual patient was generated from the set of parameters ID 5. The top-left panel in each figure shows the results of the target study (20). The others show 9 of the 100 times of VCSs. * p < 0.05, ** p < 0.01, *** p < 0.01.


