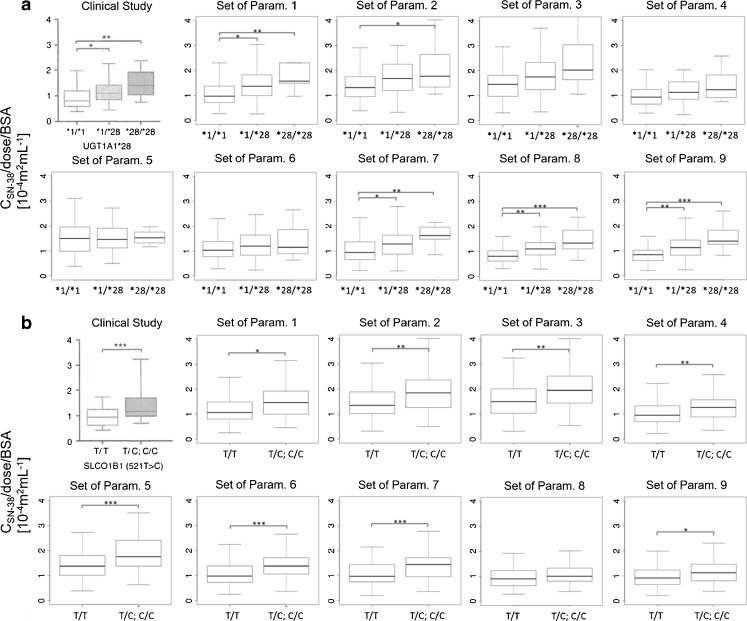
Fig. 7.
Comparison between clinical study and virtual clinical study outcomes using 9 different sets of parameters determined by CNM. (a) and (b) show the association between dose-normalized SN-38 plasma concentrations at the end of infusion (90 min) and the UGT1A1*28 genotype (a) and SLCO1B1 c.521T>C genotype (b). The top-left panel in each figure shows the results of the target study (20). The others show 9 sets of parameters of the 30 sets optimized by CNM. * p < 0.05, ** p < 0.01, *** p < 0.01.

