Figure 1.

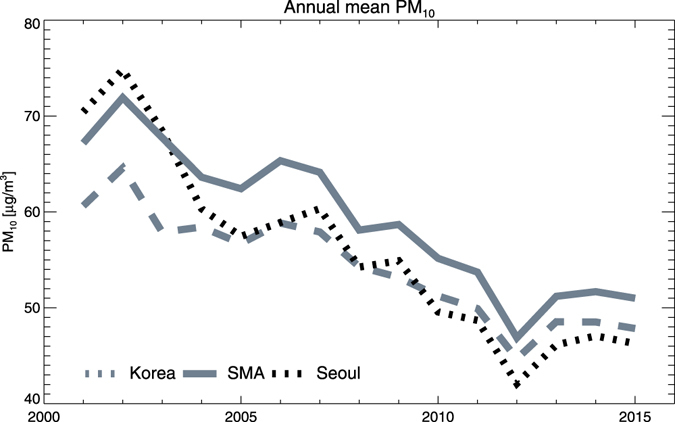
Time series of observed annual mean surface PM10 concentrations over Seoul (30 sites), the SMA (112 sites), and South Korea (247 sites) from 2001 to 2015. Box plots indicate 25th, 50th, and 75th percentiles of the SMA PM concentrations.

Time series of observed annual mean surface PM10 concentrations over Seoul (30 sites), the SMA (112 sites), and South Korea (247 sites) from 2001 to 2015. Box plots indicate 25th, 50th, and 75th percentiles of the SMA PM concentrations.