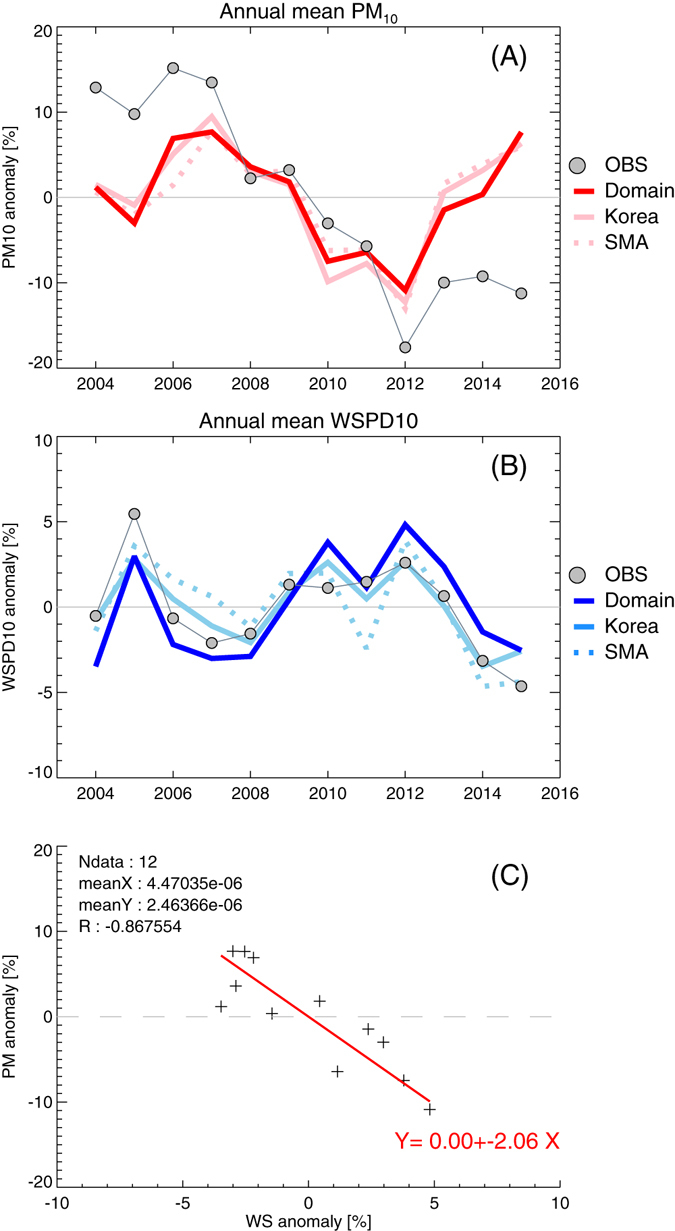
Figure 2.

Normalized anomalies of annual mean surface PM concentration (A), and annual mean 10-m wind speed (B). Red (blue), pink (light blue), and dashed pink (light blue) lines indicate anomalies of modeled PM concentrations averaged over the 9-km domain-wide, Korea (land pixels), and the SMA regions for PM concentrations (for wind speed). Circles indicate observations of surface PM concentrations (247 sites over South Korea) and wind speed (79 sites over South Korea). The scatter plot (C) shows a least square regression fit between normalized anomalies of surface PM concentrations and wind speed from the model (9-km domain average).
