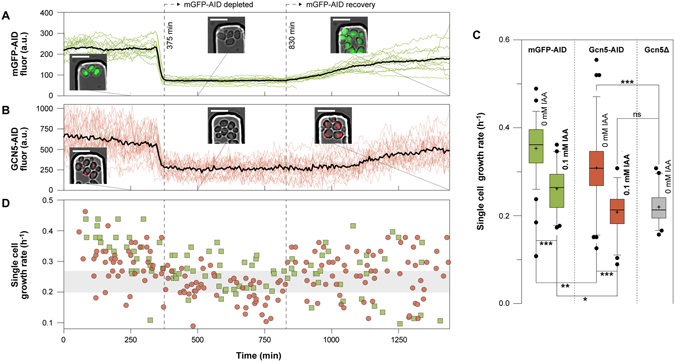
Figure 4.

The auxin-induced growth defects can be discriminated from the growth-related Gcn5 depletion phenotype. (A) Control cells expressing mGFP-AID were mixed with (B) cells expressing Gcn5-mCherry-AID and grown in the same microfluidic device on 10 gL−1 glucose. Upon the addition of auxin (0.1 mM), mGFP-AID and the nuclear Gcn5-mCherry-AID were depleted at the same time (375 min). The recovery dynamics of the two proteins after auxin removal (at 830 min) are also visible. The black trajectories correspond to the average mGFP-AID (14 cells) and Gcn5-mCherry-AID (23 cells) signals. The colored trajectories correspond to the single cell signals. Microscopy images confirm the localization and levels of the fluorescent proteins (scale 10 μm) (C) The single cell growth rates in the absence (0 mM IAA) and after the addition (0.1 mM IAA) of auxin, of mGFP-AID (green boxes), Gcn5-mCherry-AID (red boxes) and Gcn5Δ cells (grey boxes) growin in minimal medium with high (10 gL−1) glucose (error bars: 5–95 percentile, cross: mean). From left to right: 79 budding cycles from 34 cells, 40 from 14, 76 from 41, 52 from 23, 40 from 17 single cells. (Kruskal-Wallis test, Dunns post-test to compare all pairs of data, p < 0.001 ***, p < 0.01 **, p < 0.05 *, p > 0.05 ns). (D) The single cell growth rates at different time points are plotted for each yeast strain (green squares: mGFP-AID, red circles: Gcn5-mCherry-AID).
