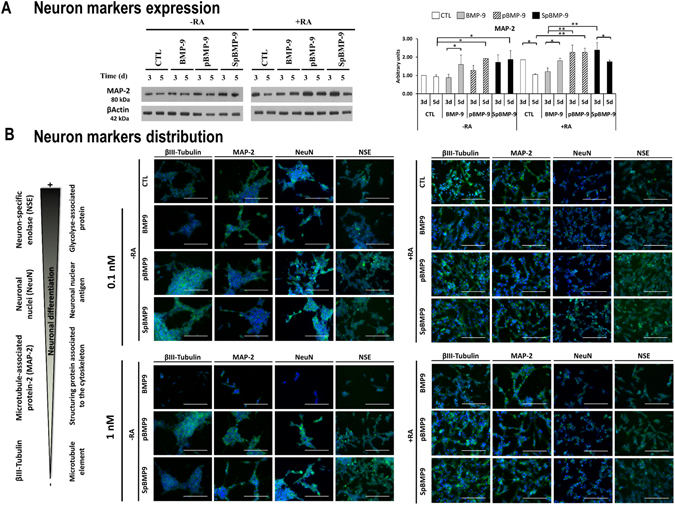
Figure 4.

Effect of pBMP-9 and SpBMP-9 on the differentiation of SH-SY5Y cells. (A) Western blots of MAP-2 and βactin (2 independent experiments) and densitometric analyses of MAP-2 bands normalized to βactin (means ± SEM) for SH-SY5Y cells stimulated with 0.1 nM BMP-9, pBMP-9 and SpBMP-9 +/− 10 μM RA for 3d and 5d (*p < 0.05, **p < 0.01). Only cropped pictures of western blots showing the 80 kDa MAP-2 isoform were presented in order to allow a better comparison between experimental conditions. Complete gel pictures are available in the supplementary data file. (B) Merged pictures showing immunostaining for neuronal differentiation markers βIII-tubulin (Alexa Fluor® 488, green), MAP-2 (Alexa Fluor® 488, green), NeuN (FITC, green) and NSE (FITC, green), and nuclei staining (Hoechst, blue) of SH-SY5Y cells stimulated for 5d with 0, 0.1 or 1 nM BMP-9, pBMP-9 and SpBMP-9 +/− 10 μM RA. Pictures are representative of at least two independent experiments (Bar = 100 μm).
