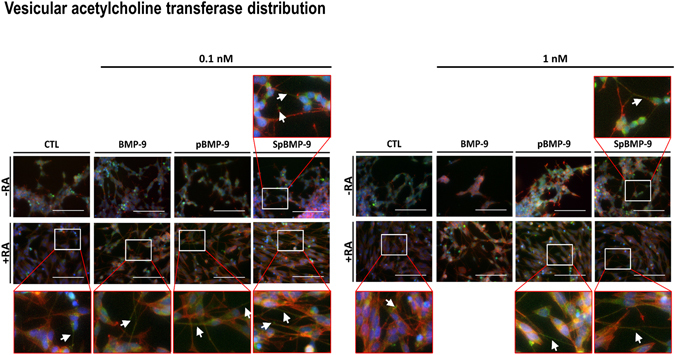
Figure 6.

Effect of pBMP-9 and SpBMP-9 on the expression and the distribution of VAchT. Merged pictures showing immunostaining for VAchT (FITC, green), actin cytoskeleton (rhodamine-phalloidin, red) and nuclei labelling (Hoechst, blue) of SH-SY5Y cells stimulated for 5d with 0, 0.1 or 1 nM BMP-9, pBMP-9 and SpBMP-9 +/− 10 μM RA. White squares show magnified zones, white arrows indicate VAchT vesicles in cell neurites (Bar = 100 μm). Pictures are representative of at least 2 independent experiments.
