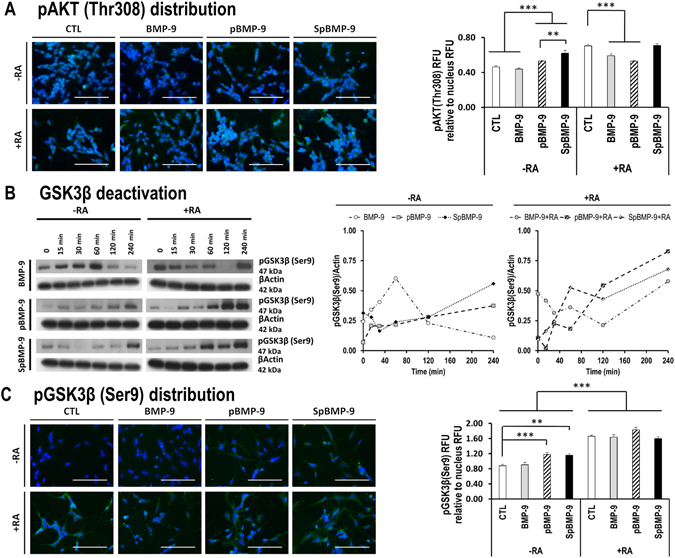
Figure 8.

Effect of pBMP-9 and SpBMP-9 on the PI3K/Akt/GSK3β pathway. (A) Merged pictures representative of at least 2 independent experiments showing immunostaining for pAkt (Thr308) (green) and nuclei (Hoechst, blue) of SH-SY5Y cells stimulated for 2 h with 0.1 nM BMP-9, pBMP-9 and SpBMP-9 +/− 10 μM RA (Bar = 100 μm) and pAkt(Thr308) fluorescence activity relative to the nucleus. (B) Western blots of phosphorylated GSK3β at Ser9 (pGSK3β) and densitometric analysis of pGSK3β bands standardized by actin showing the effect of 0.1 nM BMP-9, pBMP-9 and SpBMP-9 +/− 10 μM RA in SH-SY5Y cells after incubation for 0, 15, 30, 60, 120 and 240 min. Only cropped pictures of western blots were shown in order to allow a better comparison between experimental conditions. Complete gel pictures are available in the supplementary data file. (C) Merged pictures representative of at least 2 independent experiments showing immunostaining for pGSK3β (Ser9) (FITC, green) and nuclei (Hoechst, blue) in SH-SY5Y cells stimulated for 4 h with 0.1 nM BMP-9, pBMP-9 and SpBMP-9 +/− 10 μM RA (Bar = 100 μm). Analysis of pGSK3β(Ser9) fluorescence intensity relative to the nucleus staining was also presented. Results are the means ± SEM (**p < 0.01, ***p < 0.001).
