
Figure 1.
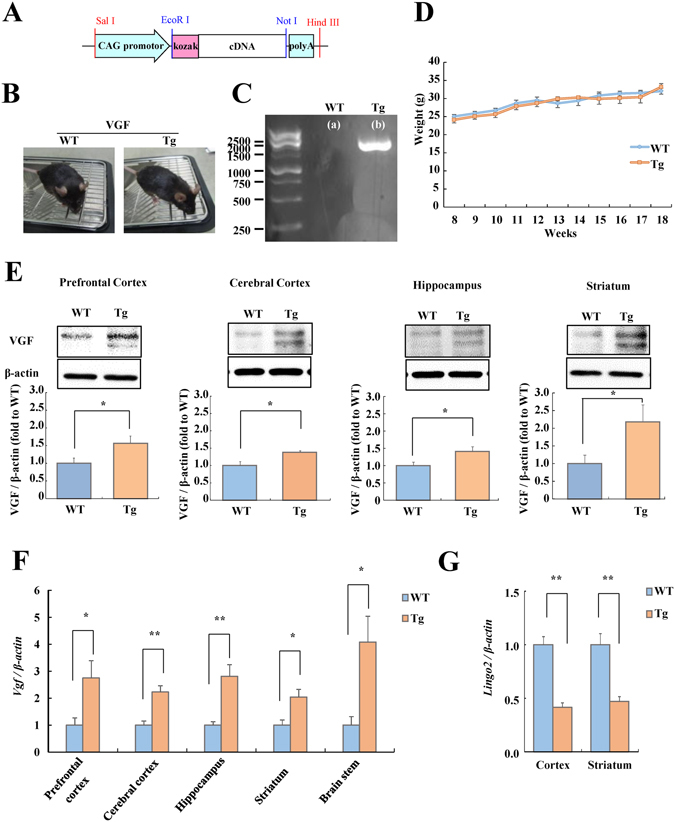
Generation of VGF-overexpressing mice. (A) Schematic representation of the VGF transgene used to generate VGF-overexpressing mice. (B) Photographs of WT (left) and VGF-overexpressing (right) mice. (C) The VGF transgene is detectable by PCR in only the VGF-overexpressing mice. (D) Comparison of the body weights of WT and VGF-overexpressing mice at 8 to 18weeks of age. Data are expressed as the mean ± SEM (WT, n = 6; Tg, n = 4). (E) Expression levels of VGF in several brain regions in WT and VGF-overexpressing mice were evaluated by western blotting relative to β-actin levels. Data are expressed as the mean fold difference versus WT mice ± SEM (WT, n = 6; Tg, n = 5). (pre: t = −2.281, df = 9, p = 0.048, ctx: t = −2.970, df = 9, p = 0.016, hip: t = −2.466, df = 9, p = 0.03 6, str: t = −2.312, df = 9, p = 0.046). Representative bands from the western blotting of VGF and β-actin are shown at the top. *p < 0.05 vs. WT mice (Student’s t-test). The cropped blots are used in this Figure and full-length blots are presented in Supplementary Figure S1. (F) Expression levels of Vgf mRNA in several brain regions in WT and VGF-overexpressing mice were evaluated by real-time RT-PCR relative to β-actin levels. Data are expressed as the mean fold difference versus WT mice ± SEM (WT, n = 4; Tg, n = 4). (pre: t = −2.512, df = 6, p = 0.046, ctx: t = −4.429, df = 6, p = 0.004, hip: t = −4.053, df = 6, p = 0.007, str: t = −3.005, df = 6, p = 0.024, stem: t = −3.048, df = 6, p = 0.023). *p < 0.05, **p < 0.01 vs. WT mice (Student’s t-test). (G) Expression levels of lingo2 mRNA in several brain regions, retina, and optic nerve in WT and VGF-overexpressing mice were evaluated by real-time RT-PCR (ctx: t = 6.844, df = 6, p < 0.001, str: t = 4.740, df = 6, p = 0.003).