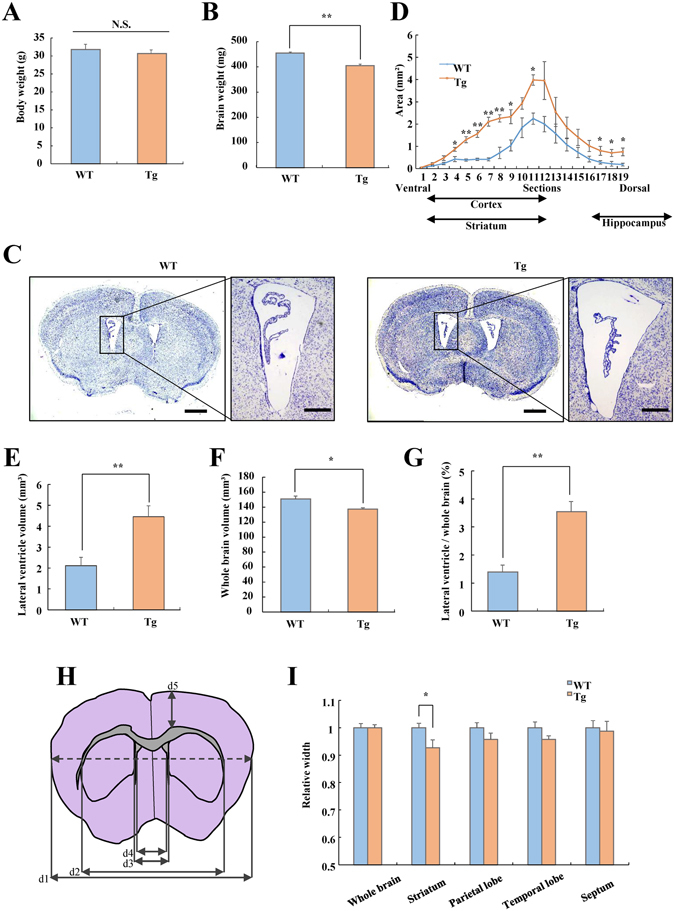
Figure 2.

Histological analysis of WT and VGF-overexpressing mice. Body weight (t = 0.643, df = 21, p = 0.527) (A) and brain weight (B) of adult WT and VGF-overexpressing mice (t = 6.136, df = 21, p < 0.001). Data are expressed as the mean ± SEM (WT, n = 10; Tg, n = 13), **p < 0.01 vs. WT mice (Student’s t-test). (C) Representative photomicrographs show coronal sections stained with cresyl violet in WT and VGF-overexpressing mice. Scale bar = 1000 µm. Right panels show enlargements of the lateral ventricle region. Scale bar = 300 µm. (D) The lateral ventricle region in WT and VGF-overexpressing mice is visualized per section in a ventral to dorsal manner. Genotype; F (1, 8) = 13.491, p < 0.001, section; F (18, 144) = 32.716, p < 0.001, genotype × section; F (18, 144) = 3.223, p < 0.001, two-way ANOVA with repeated measures (4: t = −3.015, df = 8, p = 0.017, 5: t = −6.312, df = 8, p < 0.001, 6: t = −6.789, df = 8, p < 0.001, 7: t = −8.040, df = 8, p < 0.001, 8: t = −5.145, df = 8, p = 0.001, 9: t = −3.260, df = 8, p = 0.012, 11: t = −5.042, df = 8, p = 0.001, 17: t = −2.375, df = 8, p = 0.045, 18: t = −2.579, df = 8, p = 0.033, 19: t = −3.039, df = 8, p = 0.016). In the same mice as above, the lateral ventricle volume (t = −3.560, df = 8, p = 0.007) (E), whole brain volume (t = 3.177, df = 8, p = 0.013) (F), and ratio of lateral ventricle volume to whole brain volume (t = −4.156, df = 8, p = 0.003) (G) was measured. Data are expressed as the mean ± SEM (WT, n = 5; Tg n = 5), *p < 0.05, **p < 0.01 vs. WT mice (Student’s t-test). (H) Diagram of the brain section indicates the five regions measured for length using cresyl violet. The width of each brain region was defined as follows: whole brain = d4, striatum = d3 − d2, motor cortex = d5, somatosensory cortex = d4–d3, and septum = d4. (I) Width of the whole brain, striatum, parietal lobe, temporal lobe, and septum of WT and VGF-overexpressing mice (whole brain: t = −0.020, df = 18, p = 0.984, striatum: t = 2.315, df = 18, p = 0.033, temporal lobe: t = 1.613, df = 18, p = 0.124, parietal lobe: t = 1.466, df = 18, p = 0.160, septum: t = 0.292, df = 18, p = 0.774). Data are expressed as the mean ± SEM (WT, n = 11; Tg, n = 9), *p < 0.05 vs. WT mice (Student’s t-test).
