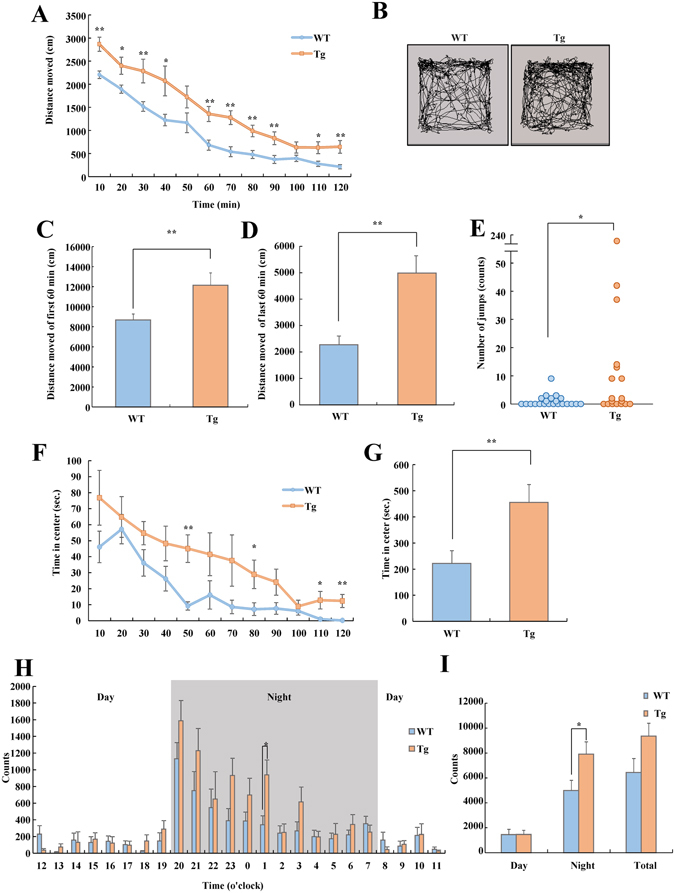
Figure 4.

VGF-overexpressing mice exhibited hyperactivity in home cage and novel environment. (A–G) Open field test. Mice were placed in an open field, and their locomotion was assessed for 120 min. WT (n = 22), VGF-overexpressing mice (n = 20). (A) Total distance was scored for each 10 min period. Genotype; F (1, 40) = 15.524, p < 0.001, time; F (11, 440) = 81.235, p < 0.001, genotype × time; F (11, 440) = 1.283, p = 0.231, two-way ANOVA with repeated measures (0–10: t = −3.894, df = 40, p < 0.001, 10–20: t = −2.542, df = 40, p = 0.015, 20–30: t = −2.856, df = 40, p = 0.007, 30–40: t = −2.555, df = 40, p = 0.015, 50–60: t = −3.487, df = 40, p = 0.001, 60–70: t = −4.082, df = 40, p < 0.001, 70–80: t = −3.386, df = 40, p = 0.002, 80–90: t = −2.867, df = 40, p = 0.007, 100–110: t = −2.556, df = 40, p = 0.014, 110–120: t = −3.104, df = 40, p = 0.003). (B) Representative images show typical examples of exploring behavior of WT and VGF-overexpressing mice during the first 10 min of the open field test. (C) Total distance of first 60 min (t = −3.188, df = 40, p = 0.003). (D) Total distance during last 60 min (t = −3.807, df = 40, p < 0.001). Data are expressed as the mean ± SEM *p < 0.05, **p < 0.01 vs. WT mice (Student’s t-test). (E) The number of jumps during first 10 min of the open field test. Actual number of jumps observed in individual mice (p = 0.020). *p < 0.05 vs. WT mice (Mann–Whitney U-test). (F) Time spent in the center was scored for each 10 min period. Genotype; F (1, 40) = 8.108, p = 0.007, time; F (11, 440) = 14.652, p < 0.001, genotype × time; F (11, 440) = 0.937, p = 0.504, two-way ANOVA with repeated measures (40–50: t = −4.171, df = 40, p < 0.001, 70–80: t = −1.911, df = 40, p = 0.027, 100–110: t = −2.219, df = 40, p = 0.032, 110–120: t = −3.121, df = 40, p = 0.003) (G) Time spent in the center throughout 120 min (t = −2.847, df = 40, p = 0.007). Data are expressed as the mean ± SEM *p < 0.05, **p < 0.01 vs. WT mice (Student’s t-test). (H,I) Locomotor activity test. Mice were placed into an open field, and their locomotion was assessed every hour for 1 day after 24 h of acclimatization (n = 8). (H) Locomotor activity throughout the 24-h period. Day: genotype; F (1, 14) = 0.001, p = 0.979, time; F (11, 154) = 1.431, p = 0.164, genotype × time; F (11, 154) = 0.920, p = 0.523, night: genotype; F (1, 14) = 5.112, p = 0.040, time; F (11, 154) = 10.352, p < 0.001, genotype × time; F (11, 154) = 1.220, p = 0.278, total: genotype; F (1, 14) = 3.729, p = 0.074, time; F (23, 322) = 14.065, p < 0.001, genotype × time; F (23, 322) = 1.569, p = 0.049, two-way ANOVA with repeated measures (t = −2.844, df = 14, p 1–2 = 0.013). (I) locomotor activity was analyzed separately during the day and night (day: t = −0.026, df = 14, p = 0.979, night: t = −2.261, df = 14, p = 0.040, t = −1.931, df = 14, p = 0.074). Data are expressed as the mean ± SEM, *p < 0.05 vs. WT mice (Student’s t-test).
