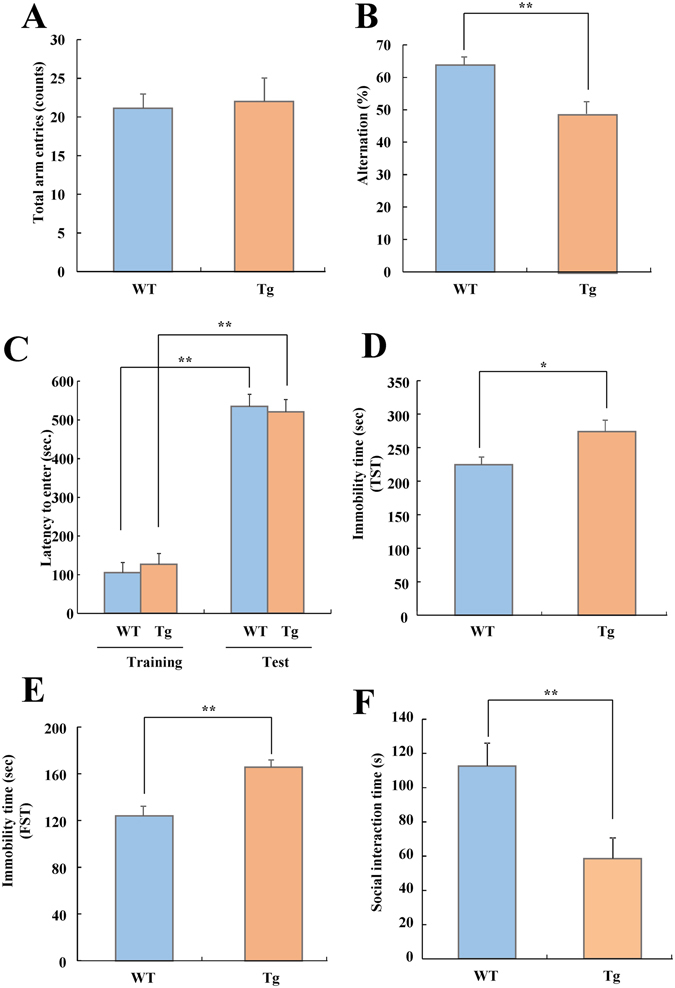
Figure 5.

Cognitive function, sociability, and depressive state of WT and VGF-overexpressing mice. (A and B) Y-maze test. WT (n = 22), VGF-overexpressing mice (n = 19). (A) The number of arm entries (t = −0.250, df = 39, p = 0.804). Data are expressed as the mean ± SEM, *p < 0.05 vs. WT mice (Student’s t-test). (B) The percentage of alternation was calculated as (actual alternations/maximum alternations-2) × 100 (t = 3.467, df = 39, p = 0.001). (C) Passive avoidance test. WT (n = 22), VGF-overexpressing mice (n = 20). Latency to enter the dark compartment in WT and VGF-overexpressing mice at training and test session. Data are expressed as the mean ± SEM. **p < 0.01 vs. training session (paired t-test). (D) Tail-suspension test of WT and VGF-overexpressing mice. WT (n = 20), VGF-overexpressing mice (n = 19). Immobile time of tail suspension test (t = −2.435, df = 37, p = 0.020). Mice were tail suspended with an adhesive tape 50 cm above the floor for 7 min, and immobile time was measured. Data are expressed as the mean ± SEM *p < 0.05 vs. WT mice (Student’s t-test). (E) Forced swimming test of WT and VGF-overexpressing mice. WT (n = 22), VGF-overexpressing mice (n = 20). Immobile time of forced swimming test (t = −3.974, df = 40, p < 0.001). Mice were placed in water for a period of 7 min; only the last 4 min immobility time was measured. Data are expressed as the mean ± SEM **p < 0.01 vs. WT mice (Student’s t-test). (F) Social interaction test. WT (n = 9), VGF-overexpressing mice (n = 8). Social interaction time measured for 10 min (t = 2.954, df = 15, p = 0.010). Data are expressed as the mean ± SEM **p < 0.01 vs. WT mice (Student’s t-test).
