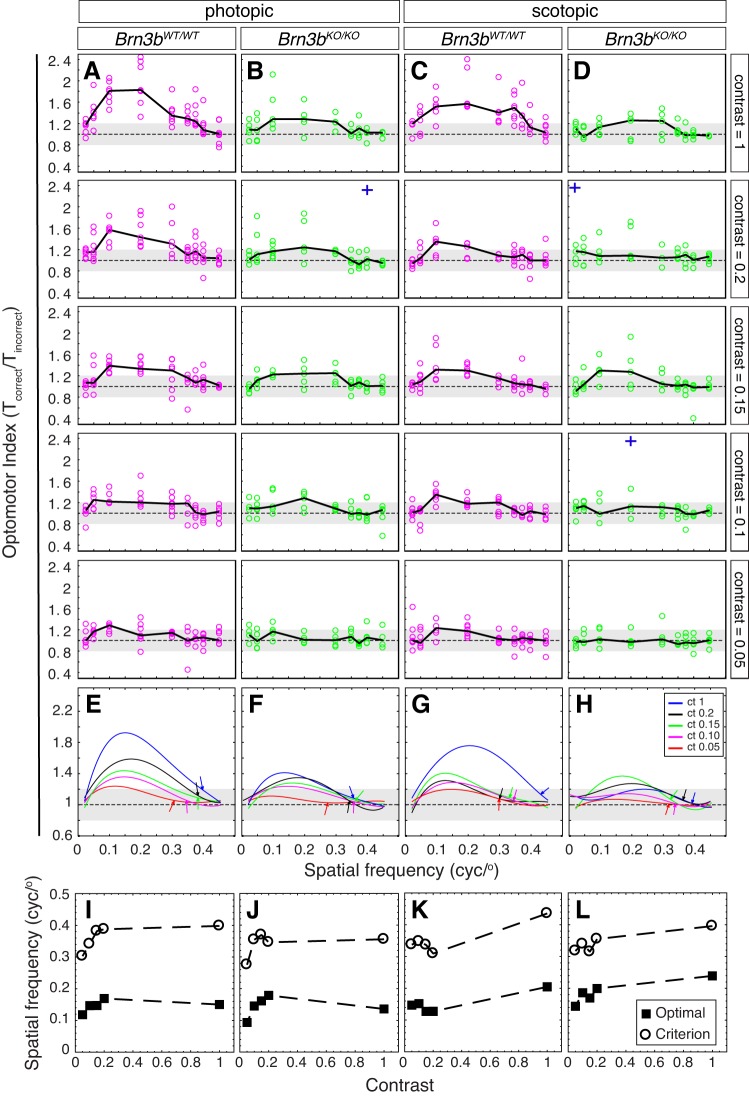
Fig. 2.
OMR dependency on visual stimulus contrast, spatial frequency, and photopic/scotopic conditions in Brn3bKO/KO and Brn3bWT/WT mice. A–D: OMR index (see Fig. 1Aiv) collected from Brn3bWT/WT (A and C, n = 7) and Brn3bKO/KO mice (B and D, n = 5) under photopic (A and B) and scotopic conditions (C and D) at 5 contrast levels (top to bottom: contrast = 1, 0.2, 0.15, 0.1, and 0.05) and 9 spatial frequencies (x-axis: 0.025, 0.05, 0.1, 0.2, 0.3, 0.35, 0.375, 0.4, 0.45). Black solid lines represent medians for all mice of the same genotype, and data points (circles) represent medians for individual animals. Each animal was measured 3 times at each condition. Note that some poor recordings were discarded from the analysis (e.g., mouse jumping off the platform), resulting in lower numbers of observations at some combinations of spatial frequency and contrast. Three outlier observations are represented as blue crosses, placed at the spatial frequencies at which they occurred. The OMRind values for the outliers were as follows: B, second plot = 3.53; D, second plot = 2.72 and fourth plot = 3.16. E–H: fourth-order polynomial fits [f(x) = a·x4 + b·x3 + c·x2 + d·x + e] for data in A–D. Coefficients a–e, R2 values, maximal OMRind, and optimal spatial frequencies are provided in Supplementary Table S1. Curve fits for contrasts (ct) = 1 (blue), 0.2 (black), 0.15 (green), 0.1 (magenta), and 0.05 (red) for each genotype and light condition have been superimposed. Throughout, the dashed horizontal line and gray area represent the median and upper and lower quartiles of the OMR index previously collected in the same setup from a set of 3 blind control animals (retinal degeneration rd1, 6 mo old). We include it to illustrate the degree of variation of the OMR index resulting from random movements in a blind mouse (i.e., independent of vision). Arrows point at the spatial frequency at which the fit has reached the 25% threshold. I–L: contrast dependency of optimal and threshold (criterion) spatial frequencies for Brn3bWT/WT (I and K) and Brn3bKO/KO mice (J and L) under photopic (I and J) and scotopic conditions (K and L), as computed from the fits in E–H (cyc/°, cycle/°). See also Supplementary Table S1.

