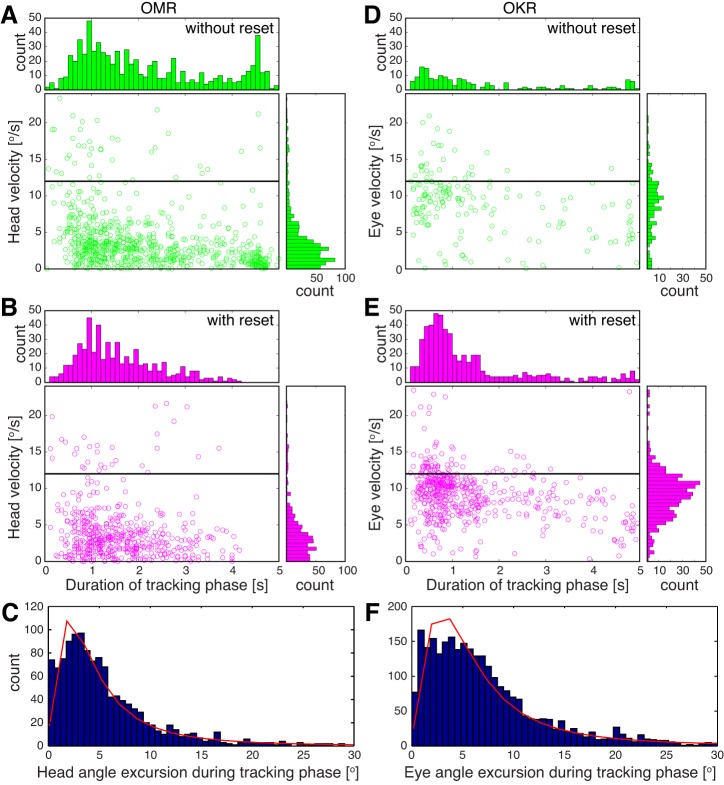
Fig. 5.
Velocity, duration, and amplitude of OMR and OKR slow phases. OMR (A–C) and OKR (D–F) were recorded from 3 Brn3bWT/WT mice at the reported optimum for OMR (contrast = 1, spatial frequency = 0.2 cycle/°, velocity = 12°/s). A and D: scatter plots and histograms for tracking phases that were not followed by reset phases. B and E: scatter plots and histograms for tracking phases that were succeeded by reset phases. Horizontal black line indicates stimulus velocity (12°/s). C and F: histograms for head (C) and eye (F) slow-phase amplitudes overlaid with the log-logistic fit (red). For C and F, slow phases were pooled regardless of the presence or absence of a fast phase.

