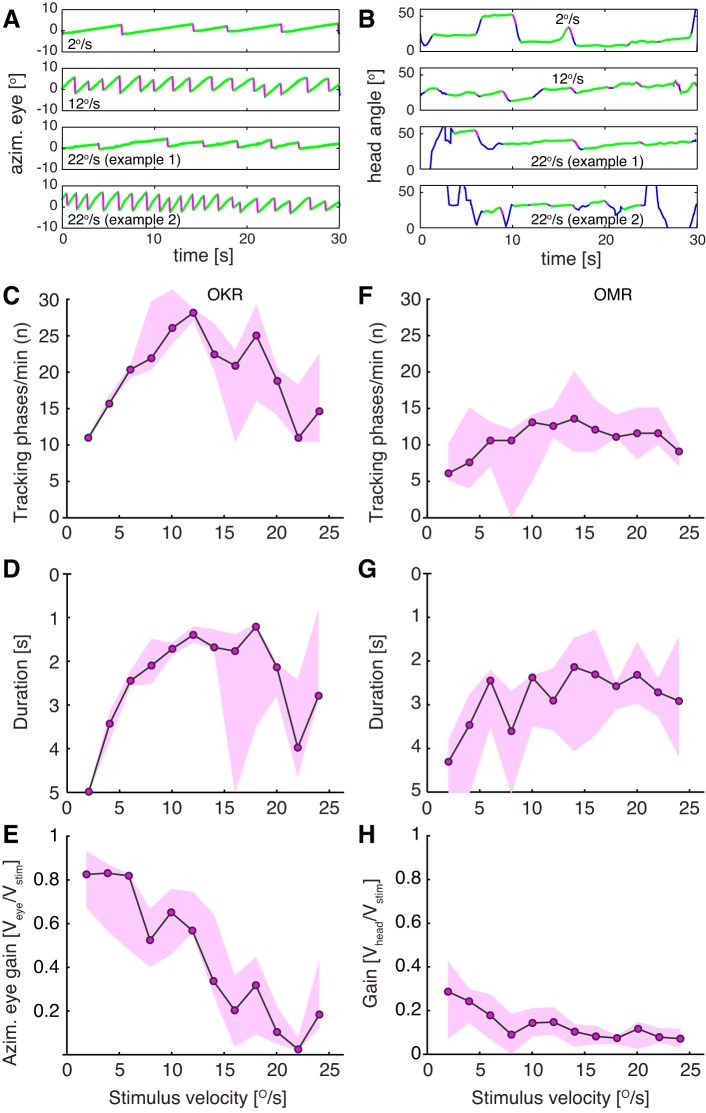
Fig. 6.
Comparison of OKR and OMR dependency on stimulus velocity. OMR and OKR were recorded from 5 animals (measured 3 times each) at contrast = 1 and spatial frequency = 0.2 cycle/°. Individual unidirectional stimulus epochs lasted for 30 s. A: example traces of eye movements at 3 different stimulus velocities (2, 12, and 22°/s). At 22°/s the animals were not able to keep up with stimulus velocity most of the time (example 1) and performed fewer tracking phases. On rare occasions, eye velocity was significantly higher and more tracking phases were performed (example 2). B: example traces of head movements at 3 different stimulus velocities (2,12 and 22°/s; examples 1 and 2). Green traces represent slow movements in stimulus direction, and magenta traces represent fast reset movements. C–H: number (C and F), duration (D and G), and gain (E and H) of OKR (C–E) and OMR (F–H) tracking phases exhibit distinct dependencies on stimulus velocity. Note that y-axes (duration) for D and G are inverted. Data are presented as medians across all animals (median of medians; black line) and range of medians for each animal (magenta areas).

