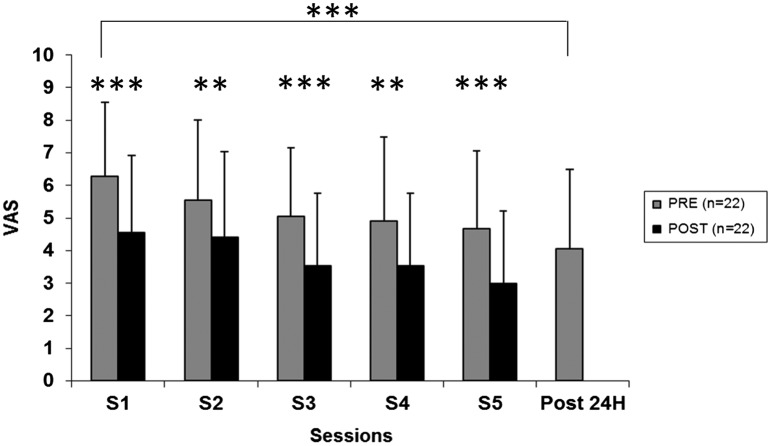
Figure 2.
Pre, post and 24-h post-pain intensity evaluation for the general population.
Notes: Pain decrease assessed by visual analog scale (VAS) before (Pre) and just after (Post) each session (s1, s2, s3, s4, s5) and 24 h after the last session (Post 24 h). Asteriks denote significant differences (**p < 0.01, ***p < 0.001).

