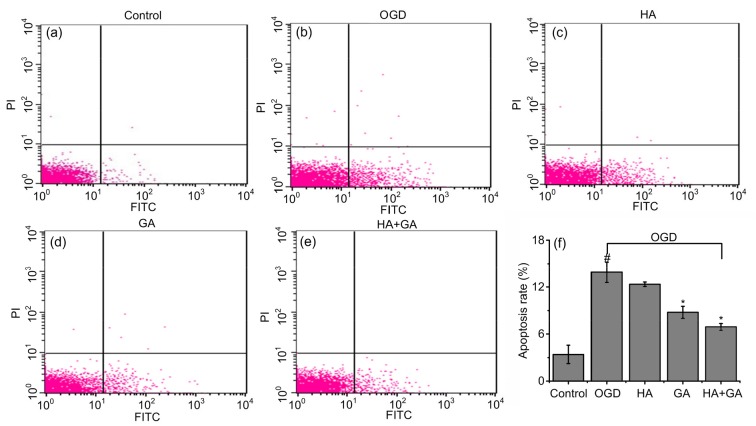
Fig. 6.
Effects of HA+GA on apoptosis rates of H9c2 cells in OGD injury
(a–e) FITC-AV/PI double staining of the control, OGD, HA, GA, and HA+GA groups. (f) Apoptotic rates of different groups. Values were expressed as mean±SD (n=6). # P<0.05 compared with the control group; * P<0.05 compared with the OGD group

