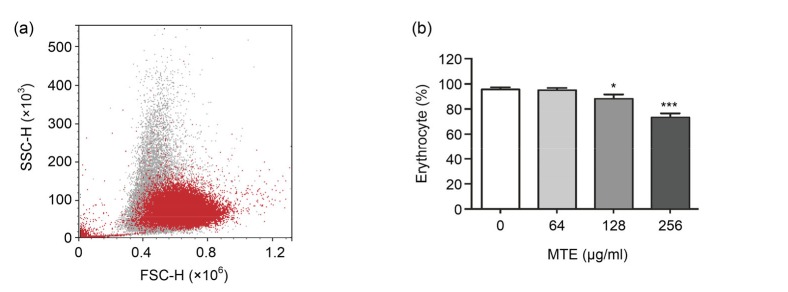
Fig. 1.
Impact of MTE on the integrated erythrocyte ratio
(a) The decreased ratio of normal erythrocyte after 256 μg/ml MTE treatment (red) compared with untreated (gray). (b) Various concentrations of MTE decreased the integrated erythrocyte ratio gradually. Data are expressed as mean±SD (n=3). * P<0.05, *** P<0.001 vs. control group (no MTE) (Note: for interpretation of the references to color in this figure legend, the reader is referred to the web version of this article)

