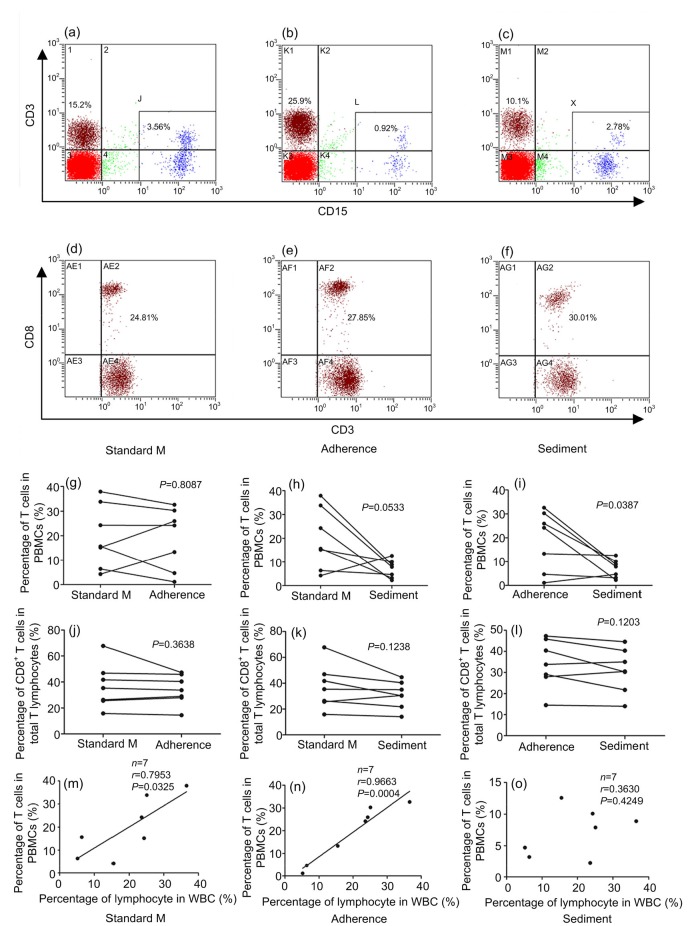
Fig. 5.
Influences of three methods on T lymphocyte percentages in PBMCs
Dot plots of CD15 staining (X-axis) versus CD3 staining (Y-axis) show characteristics of T lymphocytes and LDGs of PBMCs separated by the standard method (a), PBMC adherence method (b), and whole blood sedimentation method (c). Dot plots of CD3 staining (X-axis) versus CD8 staining (Y-axis) show characteristics of CD8+ T lymphocytes and CD8− T lymphocytes from PBMCs separated by the standard method (d), PBMC adherence method (e), and whole blood sedimentation method (f). (g–i) Comparison of T cell percentages in PBMCs between the standard method, PBMC adherence method, and whole blood sedimentation method. (j–l) Comparison of CD8+ T cell percentages in total T lymphocytes between the standard method, PBMC adherence method, and whole blood sedimentation method. (m–o) The correction between T cell percentages in PBMCs and lymphocyte percentages in white blood cells (WBCs). Standard M: standard method; Adherence: PBMC adherence method; Sediment: whole blood sedimentation method. Statistical analyses were performed using the paired t-test (g–l) and linear correlation analysis (m–o)

