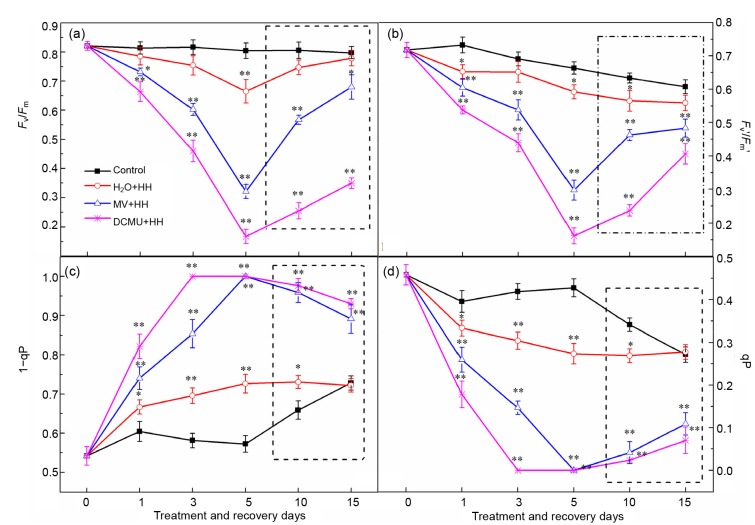
Fig. 3.
Effects of DCMU and MV on F v/F m (a), F v'/F m' (b), 1−qP (c), and qP (d) of tomato leaves under HH
The inside of the dotted line is the treatment of recovery. Data are means of six repetitions with standard errors demonstrated by vertical bars. * and ** represent significant and highly significant differences (P≤0.05 and P≤0.01), respectively

