
Figure 1.
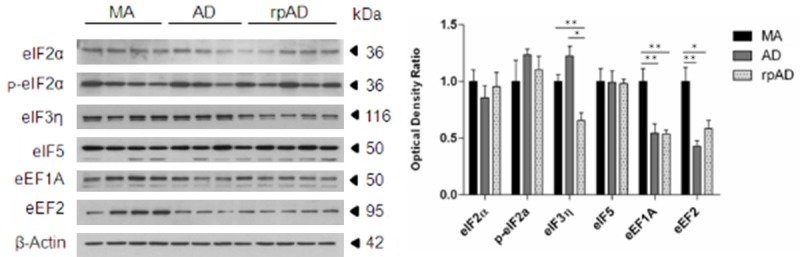
Protein expression levels of eukaryotic initiation factors eIF2α, phospho-eIF2α, eIF3η and eIF5, and eukaryotic elongation factors, eEF1A and eEF2 as revealed with gel electrophoresis and western blotting in frontal cortex area 8 in MA, AD and rpAD, and corrected with β-actin. Densitometry of western blot bands was assessed with the TotalLab program and subsequently analyzed with GraphPad Prism and Statgraphics Statistical Analysis, and Data Visualization Software version 5.1 with one-way ANOVA with post-hoc Tukey’s range test for multiple comparisons: *P<0.05; **P<0.01; ***P<0.001.