Fig. 1.

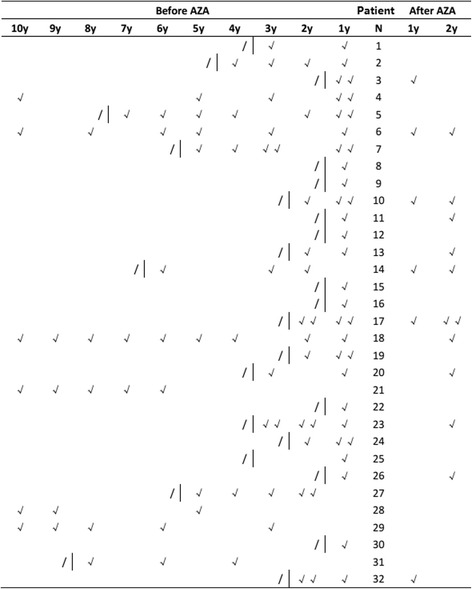
The individual relapse times of each patient within 10 years before AZA therapy and 2 years after AZA therapy. “√” denotes the time of relapse. “I” denotes the beginning of AZA therapy. “/” indicates not available

The individual relapse times of each patient within 10 years before AZA therapy and 2 years after AZA therapy. “√” denotes the time of relapse. “I” denotes the beginning of AZA therapy. “/” indicates not available