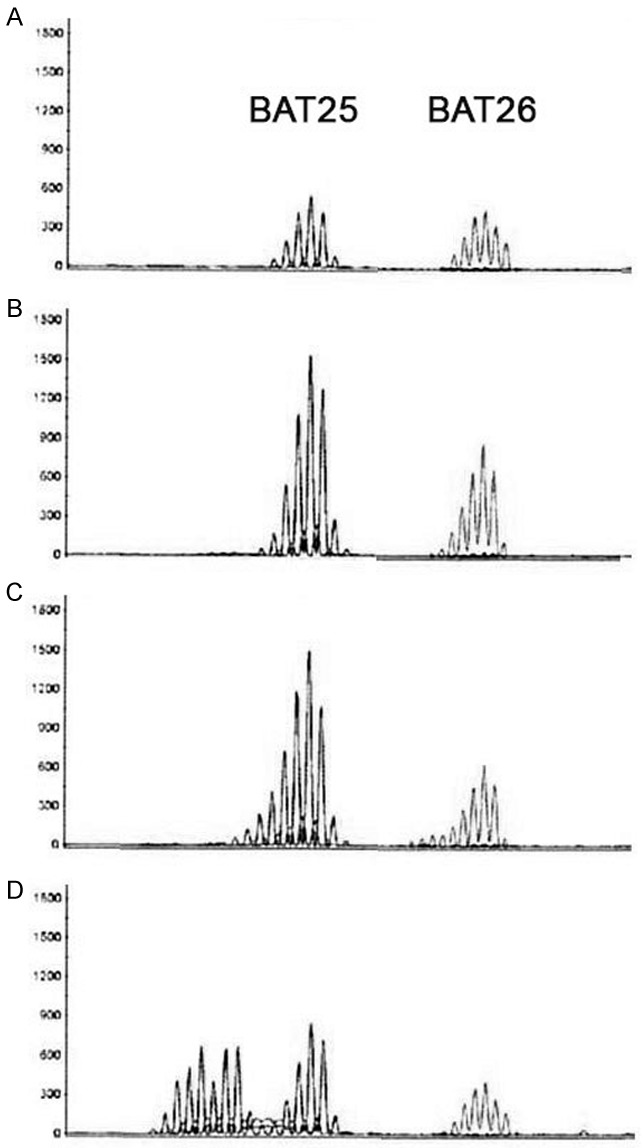
Figure 2.

MSI analysis: Paired normal and tumor results demonstrating microsatellite instability (MSI) with the noncoding mononucleotide repeats BAT25 and BAT26. A: DNA from normal mucosa. B: DNA from a tubular adenoma showing equal numbers of peaks as the normal tissue. C: DNA from a second tubular adenoma from the same segment showing additional peaks indicating MSI. D: DNA from a colon carcinoma from the same segment showing many more additional peaks indicating MSI.
