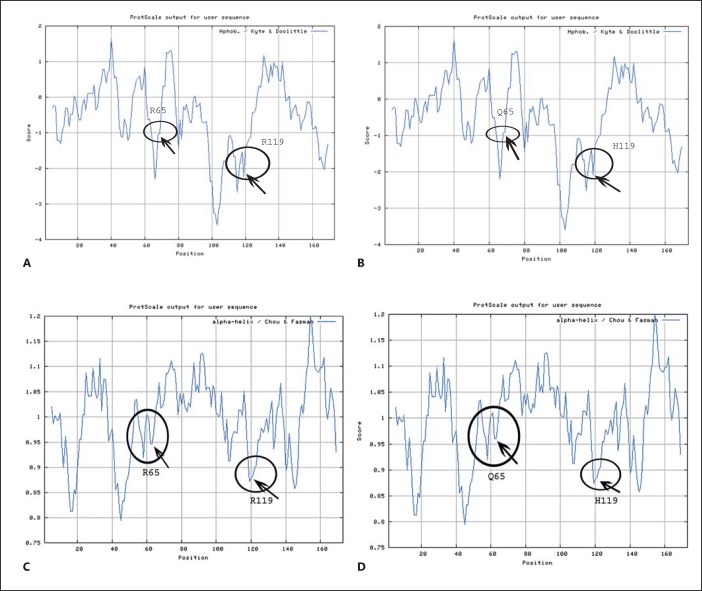
Fig. 4.
Hydrophobicity profile of wild-type and mutant (p.R65Q and p.R119H) CRYAA proteins are shown predicted by the ProtScale program at the ExPASy server. A The circles represent the hydrophobicity around R65 and R119 in the wild-type protein. B The circles represent the hydrophobicity around Q65 and H119 in the mutant protein showing a mild shift in hydrophobicity compared to the wild type. C Secondary structure formation (alpha helix in this case) property of wild-type and mutant protein predicted by ProtScale program using Chau-Fasman algorithm. D Alpha helix-forming property of each amino acid in the wild-type protein.

