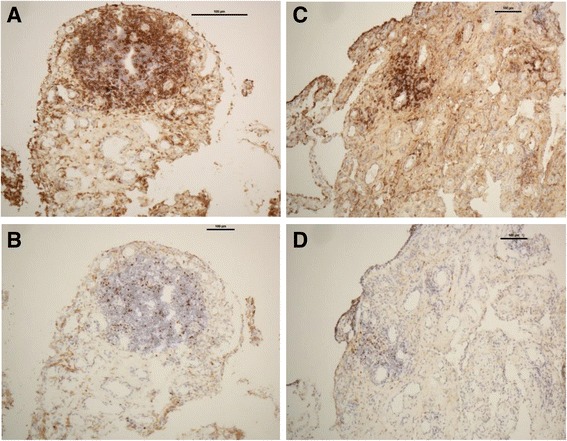
Fig. 2.

Immunohistological comparison of the expression of CD4+ and forkhead box protein transcription factor 3-positive (FOXP3+) T cells (magnification × 10) in the synovial tissue prior to and at 6 months after abatacept treatment (patient #6). Baseline images show focal infiltration of CD4+ T cells (a) and FOXP3+ T cells (b) in a villus. Decrease in CD4 expression and significant reduction in the number of FOXP3+ T cells are shown (c and d, respectively)
