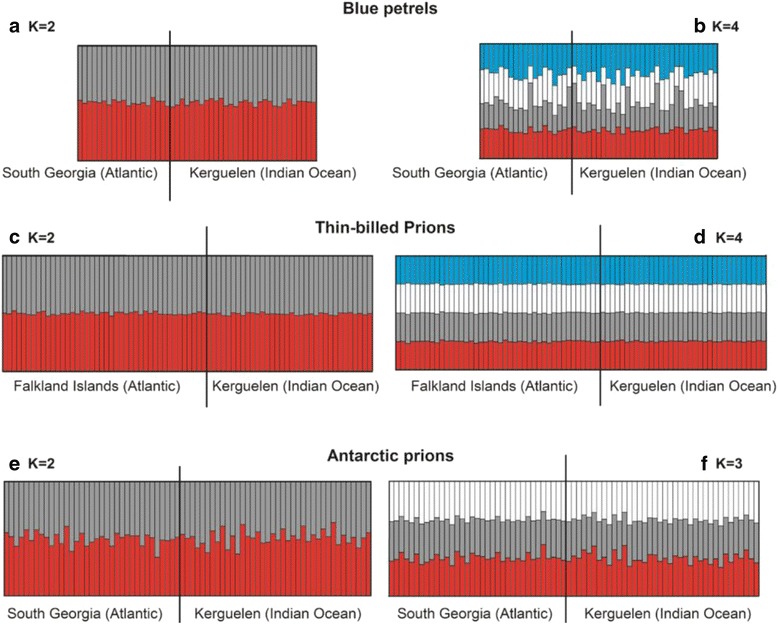
Fig. 3.

Results from cluster analysis of microsatellite data. The analyses were carried out on individuals from Atlantic and Indian Ocean populations of blue petrels Halobaena caerulea, thin-billed prions Pachyptila belcheri and Antarctic prions P. desolata, and are based on 18 microsatellite markers. The plots show the proportional membership of each individual in the genetic clusters (shown in different colours) calculated in STRUCTURE under K = 2 and the next most likely K (3 or 4), without priors
