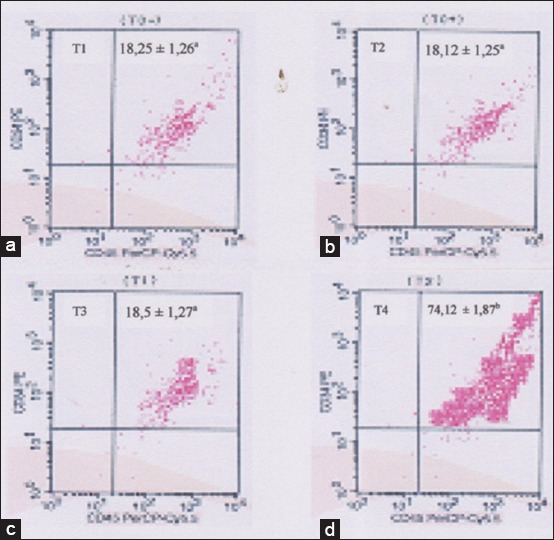
Figure-1.

Flow cytometry analysis of endogenous stem cells mobilization. (a) The control negative group (T1): Expression of CD34 and CD45 of 18.25±1.26a. (b) The control positive group (T2): Expression of CD34 and CD45 of 18.12±1.25a. (c) The group 3 (T3): Expression of CD34 and CD45 of 18.5±1.27a. (d) The group 4 (T4): expression of CD34 and CD45 of 74.12±1.87b. The different superscripts indicate significant difference at p<0.05.
