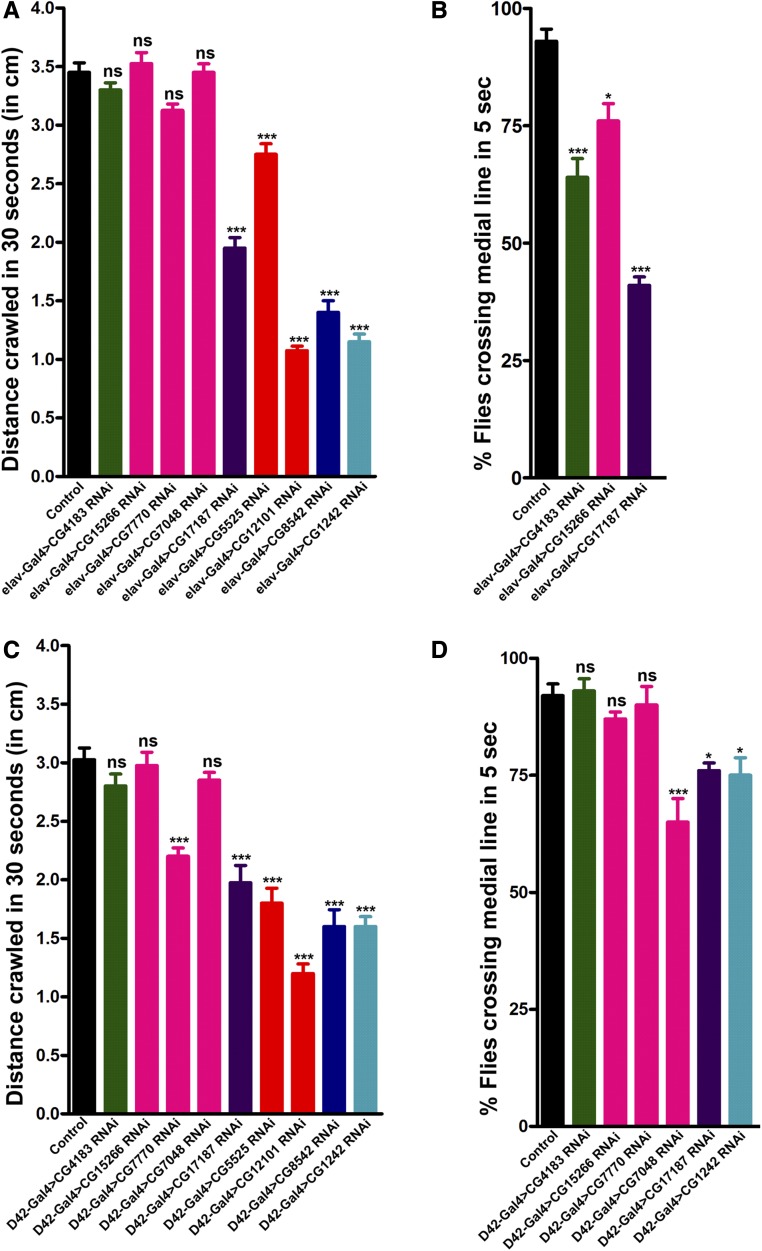
Figure 6.
Locomotive behavior affected by pan-neuronal knockdown of essential chaperones. (A) Pan-neuronal downregulation of several essential chaperones affect crawling ability of third instar larvae. Histogram showing average distance crawled in 30 sec by control larvae (3.45 ± 0.08) or larvae with pan-neuronal knockdown of CG4183 (3.3 ± 0.06), CG15266 (3.52 ± 0.09), CG7770 (3.12 ± 0.06), CG7048 (3.45 ± 0.07), CG17187 (1.95 ± 0.09), CG5525 (2.75 ± 0.09), CG12101 (1.08 ± 0.04), CG8542 (1.40 ± 0.10), and CG1242 (1.15 ± 0.06). n = 10, *** P < 0.0001. Error bars represent SEM (mean ± SEM). Statistical analysis based on one-way ANOVA with post hoc Tukey’s test for multiple comparisons. Distance crawled in 30 sec (cm) upon pan-neuronal knockdown of sHSP (green), Prefoldins (magenta), Hsp40 (violet), Hsp60 (orange), Hsp70 (dark blue), and Hsp90 (light blue) have been represented. (B) Pan-neuronal knockdown of essential chaperones affect climbing ability of adult flies. Histogram shows % flies crossing median line in 5 sec in control flies (93.00 ± 2.60) or flies with pan-neuronal knockdown of CG4183 (64.00 ± 4.00), CG15266 (76.00 ± 3.71), and CG17187 (41.00 ± 1.79). n = 10, *P < 0.01, ***P < 0.0001. Error bars represent SEM (mean ± SEM). Statistical analysis based on one-way ANOVA with post hoc Tukey’s test for multiple comparisons. Percentage of flies crossing the medial line upon pan-neuronal knockdown of sHSP (green), Prefoldins (magenta), and Hsp40 (violet) have been represented. (C) Motor neuron-specific downregulation of several essential chaperones affect crawling ability of third instar larvae. Histogram showing average distance crawled in 30 sec by control larvae (3.03 ± 0.10) or larvae with motor neuron-specific knockdown of CG4183 (2.80 ± 0.10), CG15266 (2.97 ± 0.11), CG7770 (2.20 ± 0.07), CG7048 (2.85 ± 0.07), CG17187 (1.98 ± 0.15), CG5525 (1.80 ± 0.13), CG12101 (1.20 ± 0.08), CG8542 (1.60 ± 0.15), and CG1242 (1.60 ± 0.08). n = 10, *** P < 0.0001. Error bars represent SEM (mean ± SEM). Statistical analysis based on one-way ANOVA with post hoc Tukey’s test for multiple comparisons. Distance crawled in 30 sec (cm) upon motor neuron specific knockdown of sHSP (green), Prefoldins (magenta), Hsp40 (violet), Hsp60 (orange), Hsp70 (dark blue), and Hsp90 (light blue) have been represented. (D) Motor neuron-specific downregulation of several essential chaperones affect climbing ability of adult flies. Histogram shows % flies crossing median line in 5 sec in control flies (92.00 ± 2.49) or flies with motor neuron specific knockdown of CG4183 (93.00 ± 2.60), CG15266 (87.00 ± 1.53), CG7770 (90.00 ± 3.94), CG7048 (65.00 ± 5.00), CG17187 (76.00 ± 1.63), and CG1242 (75.00 ± 3.73). n = 10, * P < 0.01 and *** P < 0.0001. Error bars represent SEM (mean ± SEM). Statistical analysis based on one-way ANOVA with post hoc Tukey’s test for multiple comparisons. Percentage of flies crossing the medial line upon motor neuron-specific knockdown of sHSP (green), Prefoldins (magenta), Hsp40 (violet), and Hsp90 (light blue) have been represented. Hsp, heat shock protein; ns, not significant; sHSP, small HSP.

