Figure 5.
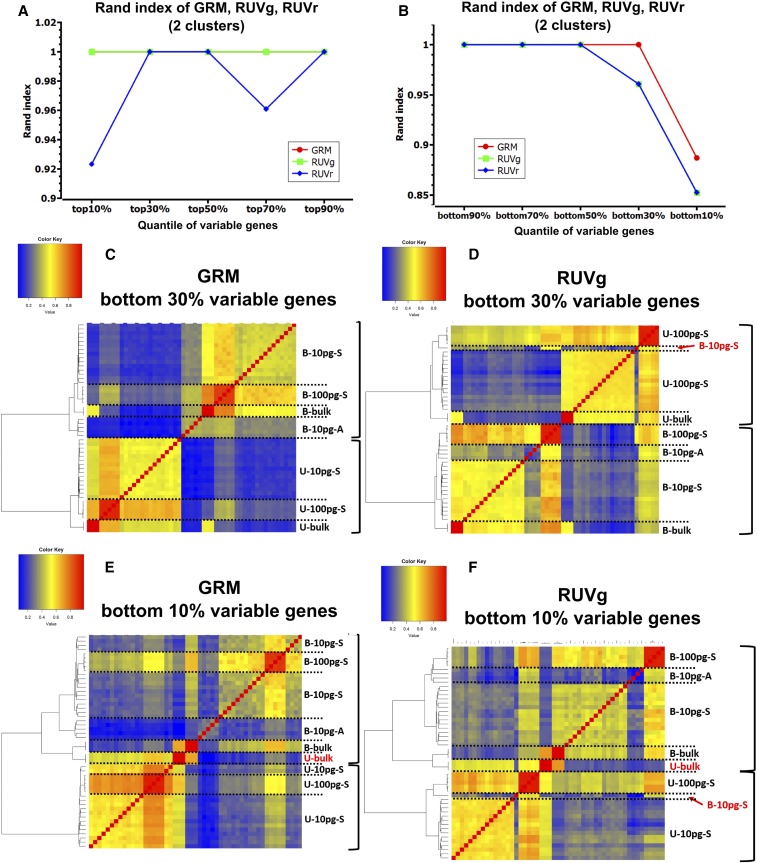
Comparison of two normalization methods using ERCC (RUVg and GRM) and one not using ERCC (RUVr) if the ground truth has two clusters (HBR and UHR samples). (A) Rand index of GRM, RUVg and RUVr with the most variable genes. (B) Rand index of GRM, RUVg and RUVr with the least variable genes. (C, D) Hierarchical clustering of GRM and RUVg using the bottom 30% variable genes. (E, F) Hierarchical clustering of GRM and RUVg using the bottom 10% variable (the most invariable) genes. Right brackets label the first branches. Red samples are wrongly clustered samples.

