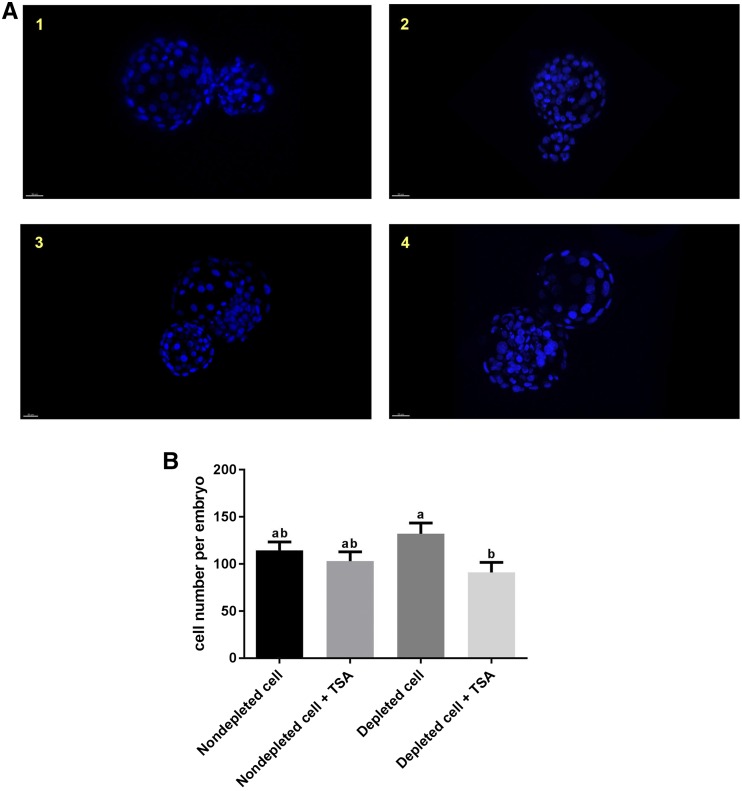
Figure 2.
Assessment of SCNT embryos. (A) Fluorescence images of SCNT embryos at the blastocyst stage stained with Hoechst 33342: (1) embryos derived from nondepleted cells in the absence of TSA; (2) embryos derived from nondepleted cells in the presence of TSA; (3) embryos derived from depleted cells in the absence of TSA; and (4) embryos derived from depleted cells in the presence of TSA. (B) Cell number in SCNT embryos at the blastocyst stage (n = 3/group). Mean values (±SEM) are shown. Different superscripts within a column indicate significant differences (P < 0.05, ANOVA with Duncan’s multiple range test).

