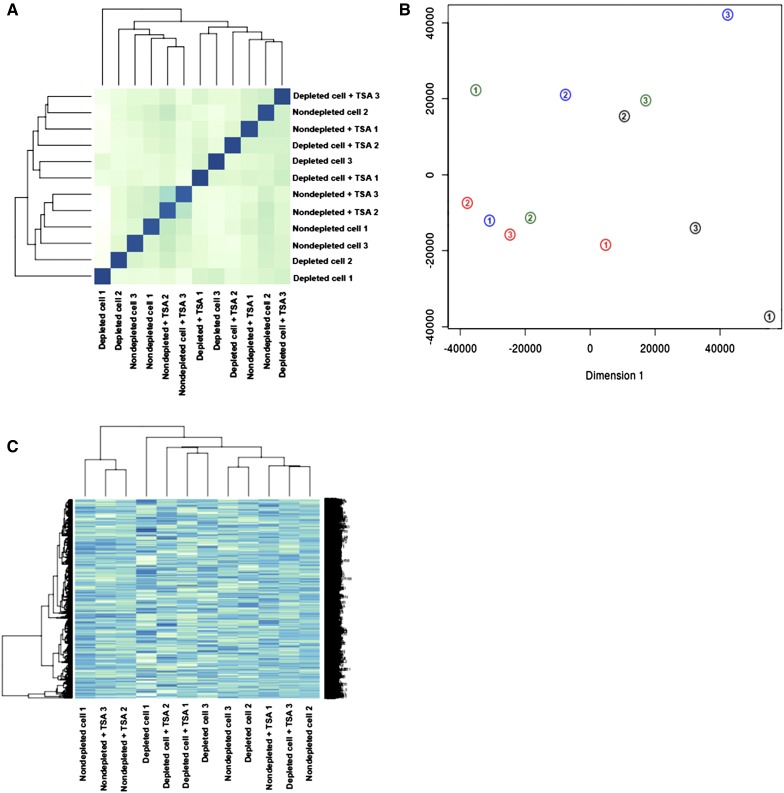
Figure 5.
Global gene expression profiles of SCNT blastocysts. (A) A dendrogram generated from sample to sample distances. (B) Principle component analysis plot; individual blastocysts (n = 3/group) derived from nondepleted cells (green), nondepleted cells in the presence of TSA (blue), depleted cells (black), and depleted cells in the presence of TSA (red) are numbered. (C) Heat map of the 1000 most highly expressed genes, showing the correlations among each group of blastocysts. These blastocysts do not group according to their treatment.

