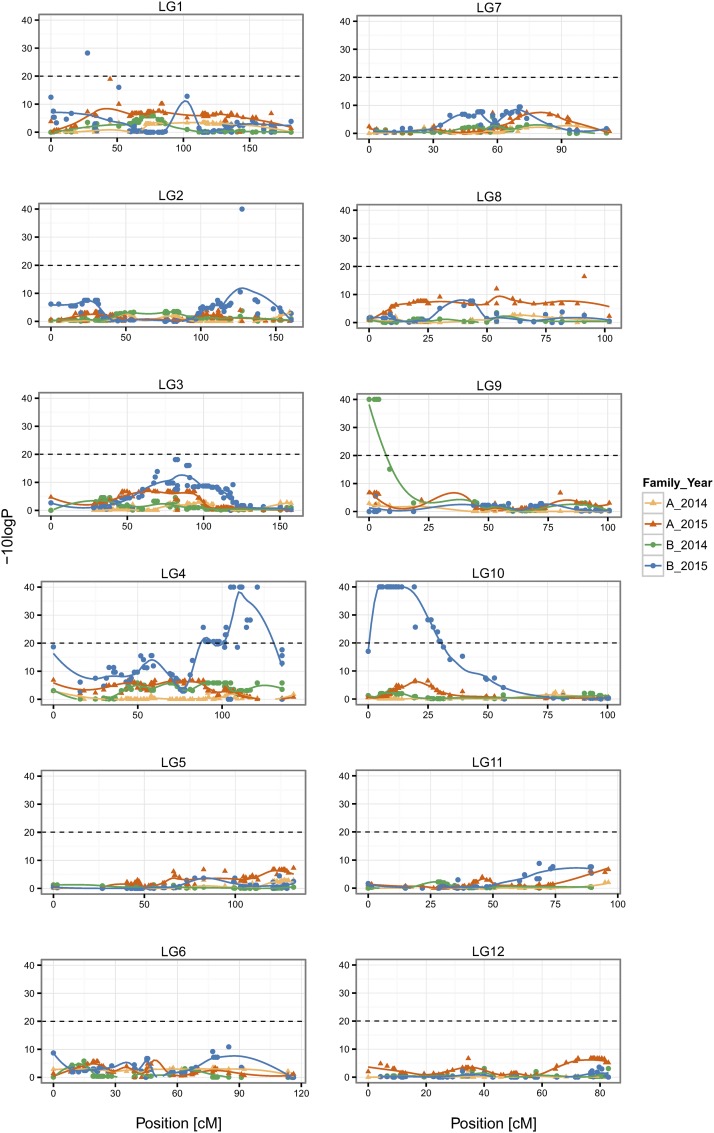
Figure 3.
Transmission ratio distortions (TRDs) shown on the consensus map. Departures of genotype counts from Mendelian expectations were tested with the Exact Multinomial Test and the nominal P are given as −10logP, the dashed line indicates the nominal P of 0.01. Polynomial regression trend lines are shown.

