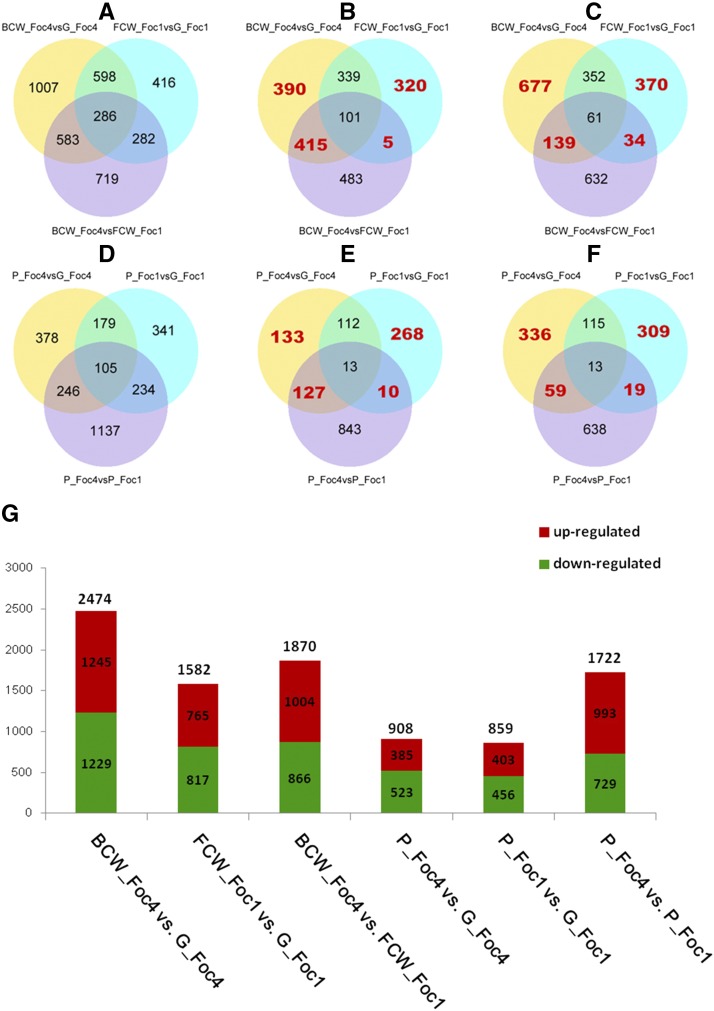
Figure 3.
Number of differentially expressed genes (DEGs) in cells grown with host cell wall polysaccharides. The number of DEGs that were up- and downregulated in each comparison are shown in the Venn diagrams (A–F) and histogram (G). The number of DEGs (A), including upregulated (B) and downregulated DEGs (C), derived from comparing cells grown in the presence of host cell wall. The number of DEGs (D), including upregulated (E) and downregulated DEGs (F), derived from comparing cells grown in the presence of pectin. The numbers of specific DEGs regulated by Foc1 or Foc4 were shown in the nonoverlapping regions (red numbers). The DEGs were identified by applying a threshold of q-value ≤ 0.005 and an absolute value of |log2(fold-change)| ≥ 1.

