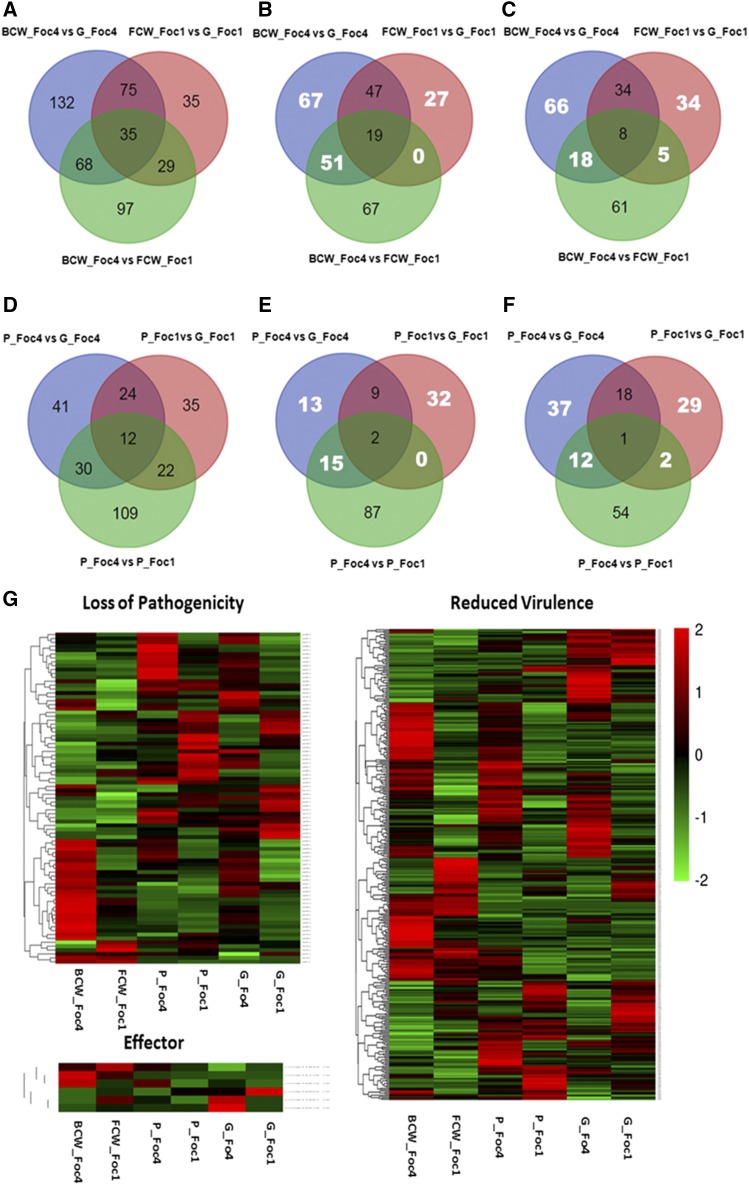
Figure 4.
The expression profiles of genes related to host–pathogen interactions induced by host cell polysaccharides. The number of differentially expressed genes (DEGs) related to host–pathogen interactions showed in Venn diagram form (A–F). The number of DEGs (A), including upregulated (B) and downregulated DEGs (C), derived from comparisons induced by host cell wall. The number of DEGs (D), including upregulated (E) and downregulated DEGs (F), derived from comparisons induced by pectin. The numbers of specific DEGs homologous to pathogen–host interaction (PHI) genes regulated by Foc1 or Foc4 were shown in the nonoverlapping regions (white numbers). Expression profiles of putative pathogenicity genes homologous to genes associated with loss of pathogenicity, reduction of virulence, and pathogenic effectors in the PHI database were present in Heatmaps (G). Heatmaps represent fragments per kilobase of transcript per million fragments sequenced (FPKM) values of a unigene in each library.

