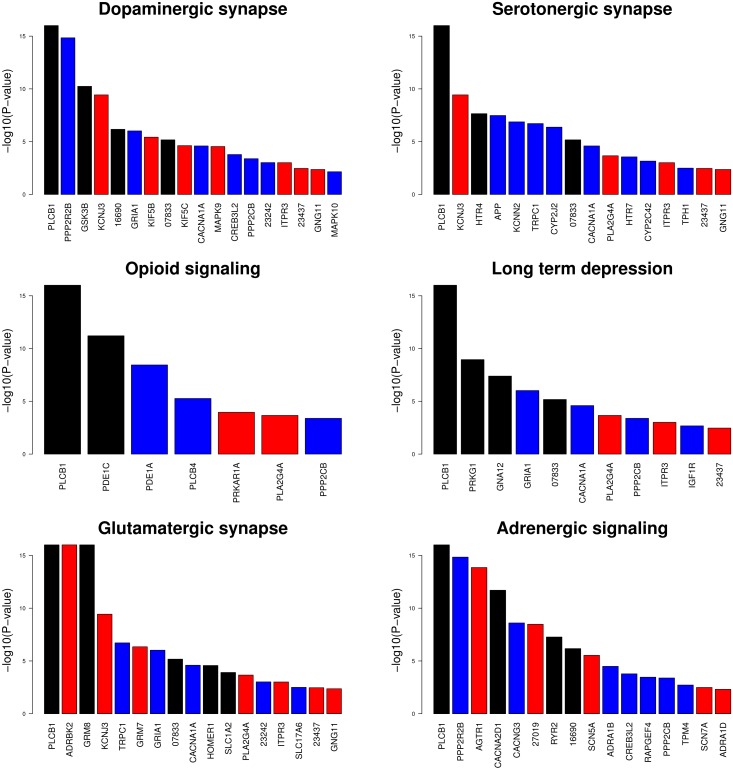
Figure 2.
Gene P-values (−log10) of significant genes at the 1% nominal level in Europe (red bars), in Asia (blue bars,) or both continents (black bars) from the significant differentiated (Fst) pathways involved in behavior. When a gene was significant in both continents, the smallest P-value is plotted. Gene symbols are provided when available; otherwise numbers indicate ensembl ENSSSCG id.

