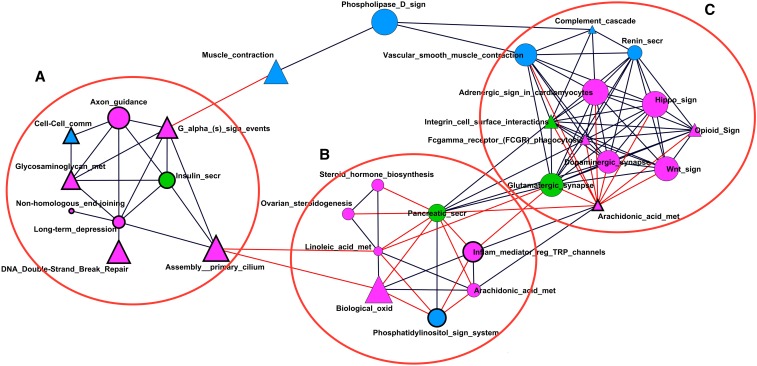
Figure 4.
Coassociation network among the 31 interconnected significant pathways. Each node represents a pathway that is connected by an edge if partial correlation with another pathway is significant and >0.8 (in absolute value). Node size is proportional to number of genes in the pathways. Node shapes represent pathway source: triangles for REACTOME and circles for KEGG. Colors indicate the population with lowest Fst (statistical significance for differentiation) P-value: pink for Asia, blue for Europe, and green for equal significance. Node line width to pathway variability: thin and thick lines for pathways with variability below and above average, respectively. Black and red edges represent positive and negative correlations between pathways, respectively. The three main pathway clusters are identified with letters A–C.

