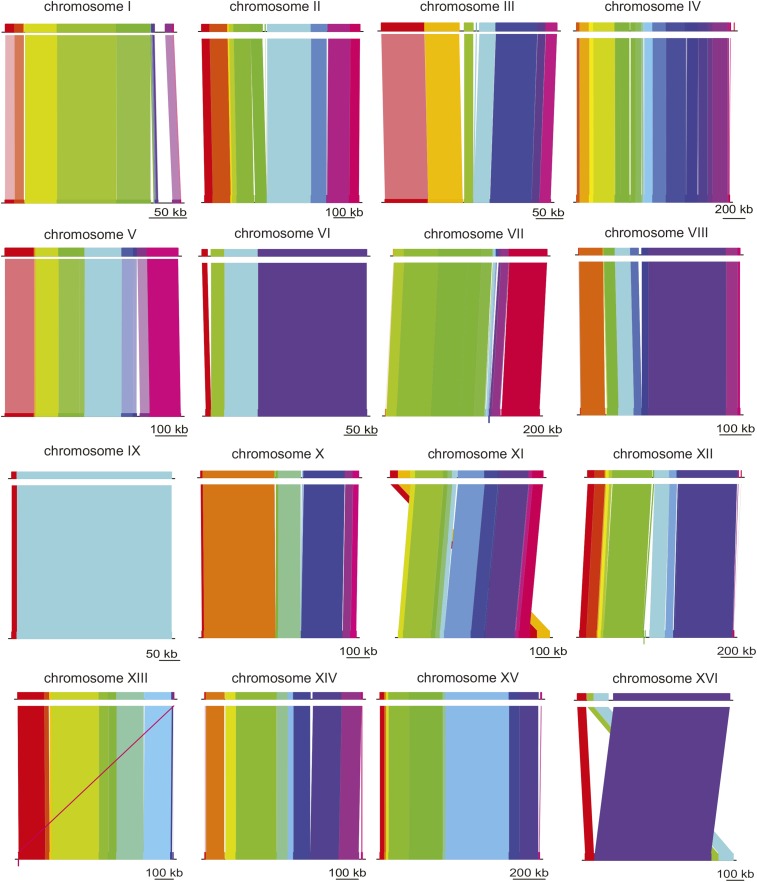
Figure 1.
Highly similar genome structure between W303 and its ancestor, S288C. Chromosome alignments of W303 (top) and S288C (bottom) are shown. The color blocks do not signify the degree of sequence similarity, instead they represent stretches of homology without gaps or rearrangements. Scale bars are shown for reference below each alignment.

