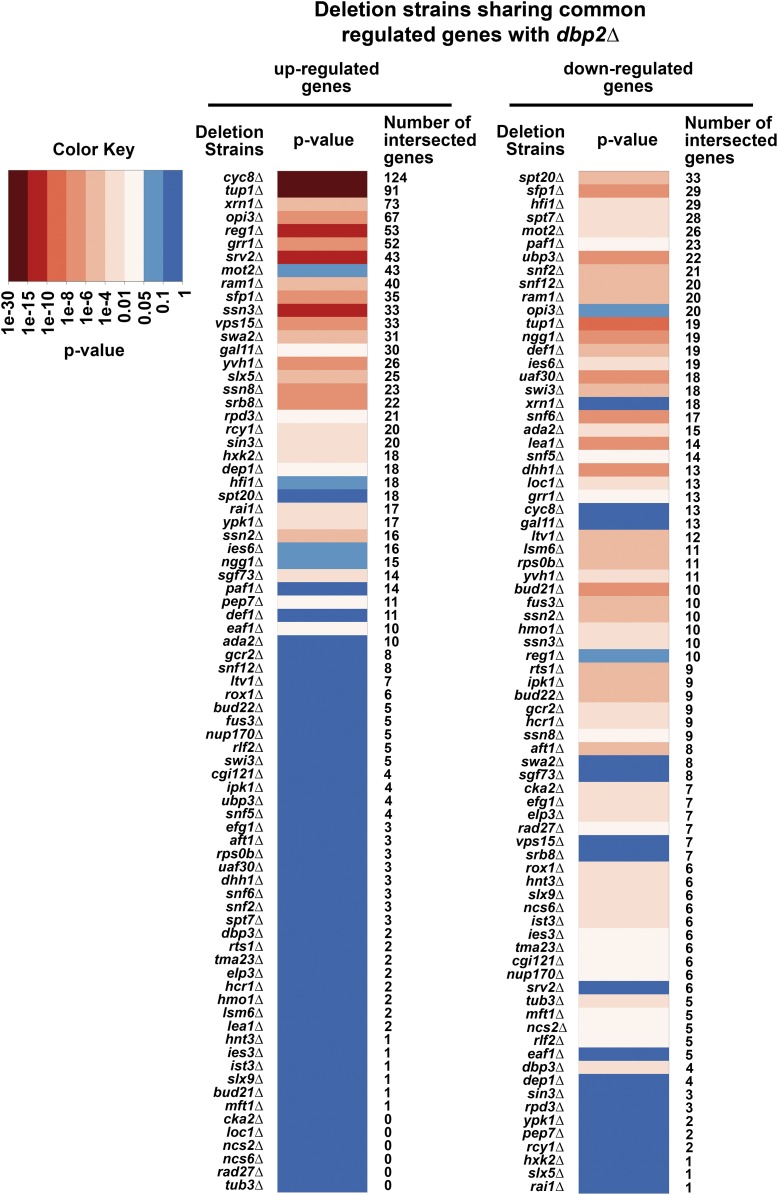
Figure 1.
Dbp2 and other gene regulatory factors share coregulated genes. A heatmap of P-values of the transcriptional profile comparisons between dbp2∆ and other deletion strains is shown and sorted by the number of intersected genes. Lists of DEGs in dbp2∆ were compared to that of 700 deletion strains (Beck et al. 2014; Kemmeren et al. 2014). One-sided Fisher’s exact test was used to estimate the significance of the observed intersection (Bonferroni correction). Common genes between the two studies (Beck et al. 2014; Kemmeren et al. 2014) were used as background. SGGs (O’Duibhir et al. 2014) were filtered from the DEG lists to help identify more direct effects of the deleted genes. A heatmap of the P-values indicating significant similarities (P ≤ 0.05, light to dark red; color key) or no similarities (P > 0.05, light to dark blue; color key) of the coregulated genes between deletion strains and dbp2∆ was generated. Deletion strains sharing significant up- and/or downregulated genes with dbp2∆ are included in the heatmap. The heatmap was sorted by the number of intersected up- (left) or downregulated (right) genes between dbp2∆ and the number of intersected genes in each comparison is listed on the right-hand side of each heatmap.

