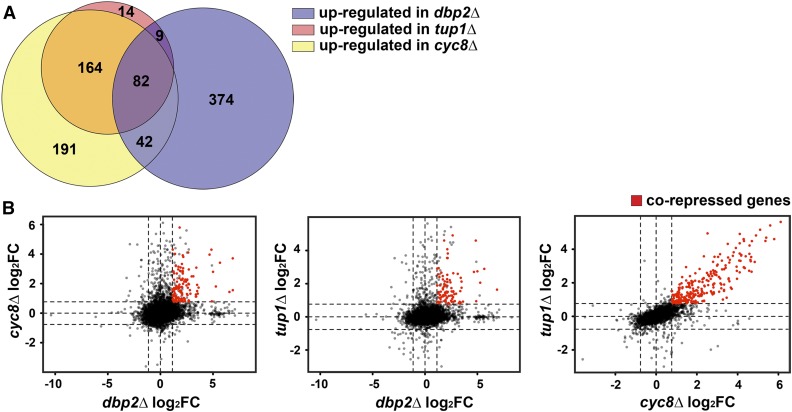
Figure 2.
TUP1 and CYC8 share corepressed genes with DBP2. (A) Venn diagram showing the numbers of genes upregulated upon loss of CYC8, TUP1, and DBP2. The Venn diagram was generated by BioVenn (Hulsen et al. 2008). SGGs were removed from the gene lists. (B) CYC8 and TUP1 repress a common subset of genes with DBP2, but to a different extent. The log2FC of all genes except SGGs in cyc8∆ and tup1∆ was plotted against that of dbp2∆, as well as of each other. Genes that are significantly upregulated between dbp2∆ and cyc8∆ (left), dbp2∆ and tup1∆ (middle), or cyc8∆ and tup1∆ (right) are colored in red. Dashed lines mark the log2FC cutoff in dbp2∆ [±log2(2.2)], cyc8∆, and tup1∆ [±log2(1.7)].

