Figure 3.
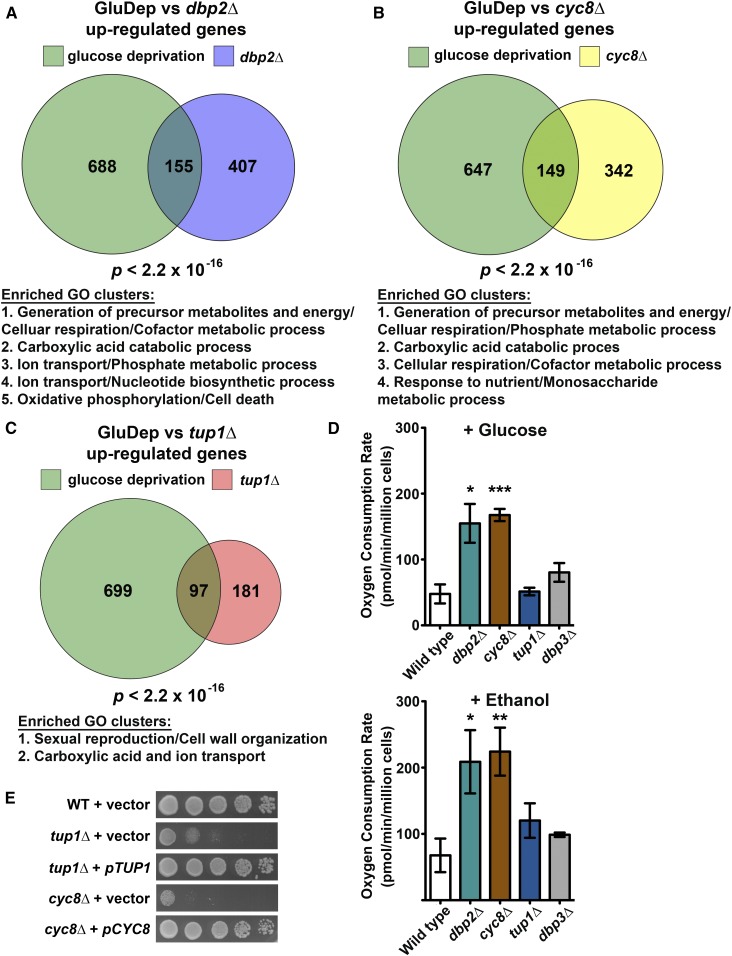
DBP2 and CYC8, but not TUP1, are linked to cellular respiration. (A–C) Glucose repressed genes are enriched in DBP2 (A), CYC8 (B), and TUP1 (C) targets. A Venn diagram showing the number of genes upregulated in dbp2∆, cyc8∆, tup1∆, and upon glucose deprivation for 2 hr is shown (Freeberg et al. 2013). The P-value originates from one-sided Fisher’s exact tests conducted to estimate the significance of the intersection. Descriptions of enriched GO clusters for the intersected genes in each Venn diagram are listed below each of the Venn diagrams. See Table S4, Table S5, and Table S6 for complete results of the functional annotation clustering analysis. (D) Loss of DBP2 or CYC8 leads to increased respiration, even in the presence of glucose. Oxygen consumption in wild-type cells and indicated mutant cells was measured using the Seahorse XFe24 analyzer in the presence of 2% glucose or 2% ethanol. The dbp3∆ strain harbors a deletion of the DEAD-box protein Dbp3 involved in rRNA processing, and serves as a negative control. Data show the mean ± SD of three independent biological replicates. *P < 0.05, **P < 0.01, ***P < 0.001. (E) Ectopic expression of CYC8 or TUP1 from a CEN plasmid rescues the heat sensitivity of cyc8∆ and tup1∆, respectively. Serial dilutions of wild-type (WT), cyc8∆, and tup1∆ strains harboring an empty vector (pRS315), cyc8∆ strain harboring pCYC8, and tup1∆ strain harboring pTUP1 were spotted on SC-LEU plates and incubated at 37°.

