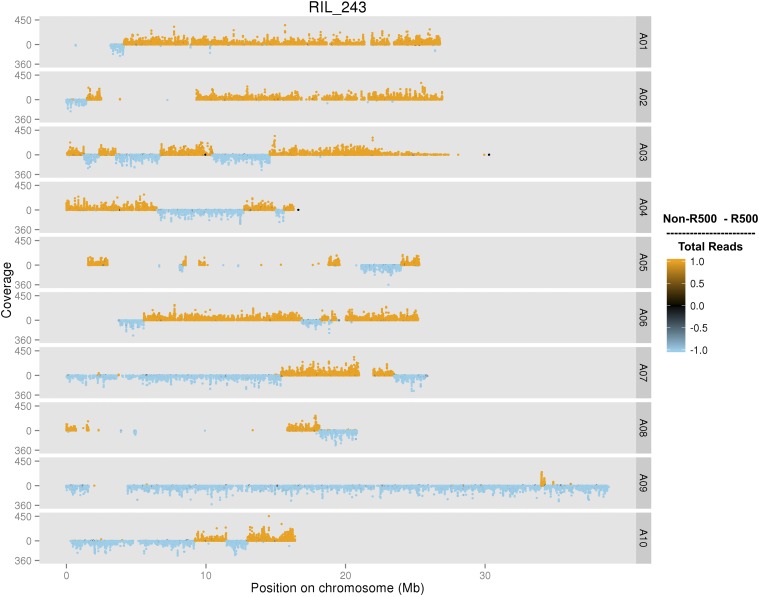
Figure 2.
An individual plot of a RIL genotyped with the population-based SNP set. Each of the B. rapa 10 chromosomes are displayed (A01–A10) with count coverage of each SNP at each physical position on the chromosome in megabases (Mb). The color indicates the relative ratio of coverage between R500 and IMB211 for each SNP. RIL, recombinant inbred line; SNP, single nucleotide polymorphism.

