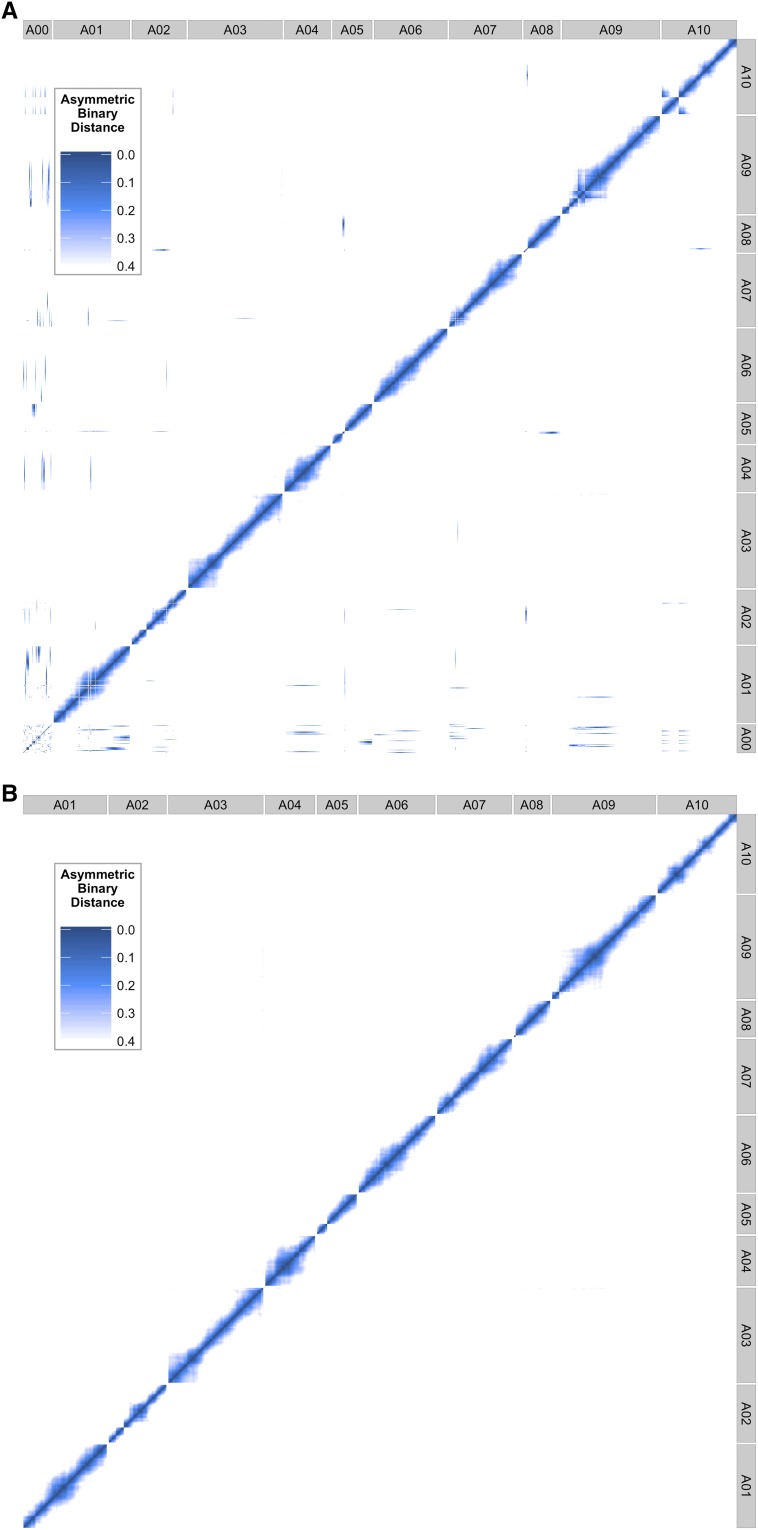
Figure 6.
Genome-wide asymmetric binary distance plots for each marker compared against every other marker (A01–A10). (A) Contains the unplaced genomic scaffold sequences (see A00). Dark blue indicates high correlation (low asymmetric binary distance), while white indicates no correlation. (B) The final position of each marker and scaffold after applying our pipeline.

