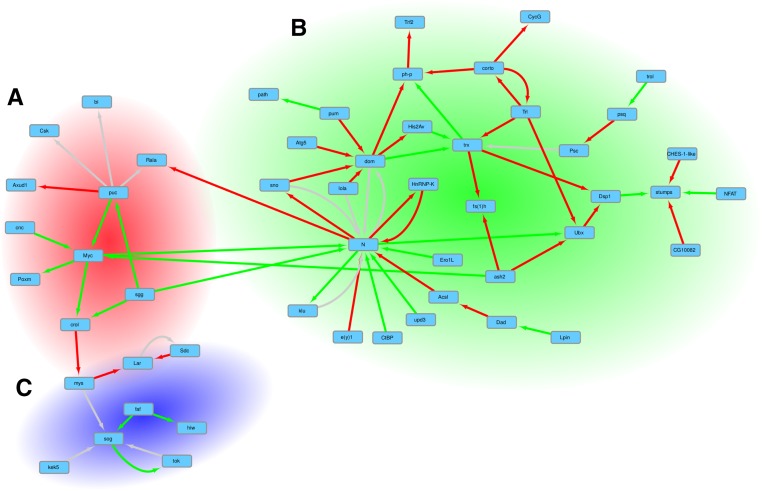
Figure 3.
Network of genetic interactions between the genes that were most targeted by TFOs. The search for genetic interactions among the genes mostly targeted by pre-lncRNA and pre-mRNA TFOs identified a set of genes shaping a large interacting network. On the graph, red arrows represent a relation of suppression, green arrows represent a relation of enhancement, and gray arrows identify the cases when there is both a relation of suppression and a relation of enhancement. The graph can be divided into three subnetworks. The GO enrichment analysis performed on the genes composing the subnetworks produces an overrepresented annotation corresponding to different processes. (A) The 13 genes in this subnetwork are enriched with terms related to the regulation of cellular process, organ development, and morphogenesis. (B) This large cluster of 34 genes is enriched with terms related to morphogenesis and tissue development. (C) A cluster of eight genes related to axon guidance, locomotion, and the response to external stimulus.

