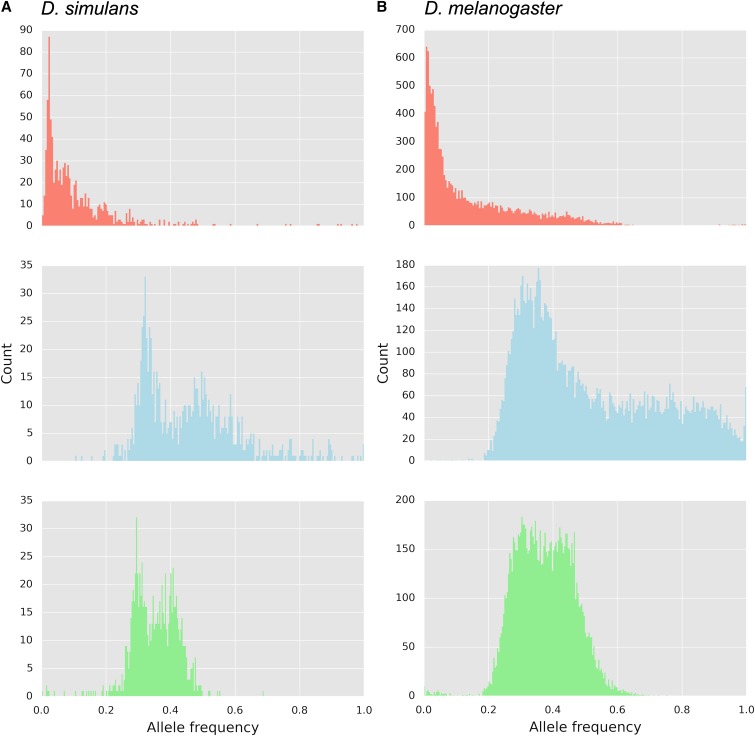
Figure 1.
Allele frequency distribution of candidate SNPs averaged across replicates in (A) D. simulans and (B) D. melanogaster. Founder population (top panels), generation 60/59 (middle panels), and frequency change (bottom panels) of candidate SNPs. Candidate SNPs were determined from an empirical 2% false positive rate determined by neutral simulations assuming no linkage.

