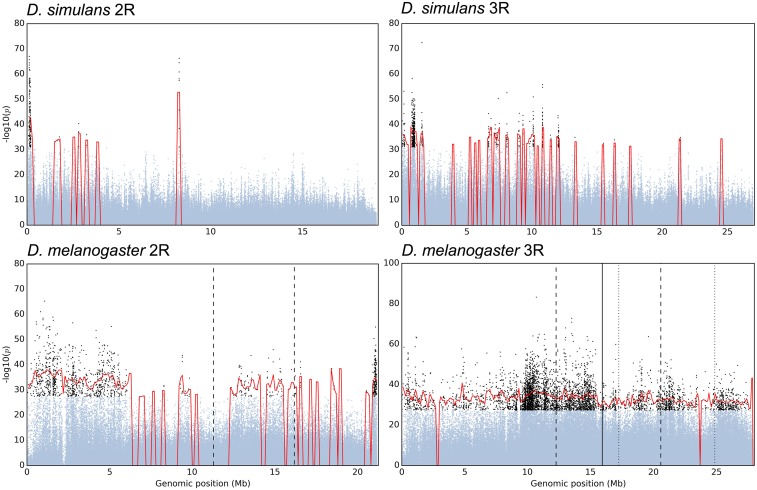
Figure 3.
Identification of selected regions on two chromosome arms: Manhattan plots of chromosome arms 2R (left panels) and 3R (right panels) are shown for D. simulans (top panels) and D. melanogaster (bottom panels). The CMH p-values of candidate SNPs (black dots) were averaged across 200-kb windows, over sliding intervals every 100 kb. Adjacent windows with average p-values above CMH cutoffs (see Materials and Methods) were merged (red lines). Boundaries of the inversion in 2R [In(2R)Ns] are shown in dashed lines. Three overlapping inversions in 3R, i.e., In(3R)Payne, In(3R)Mo, and In(3R)C are indicated with dashed, dotted, and solid lines, respectively.

