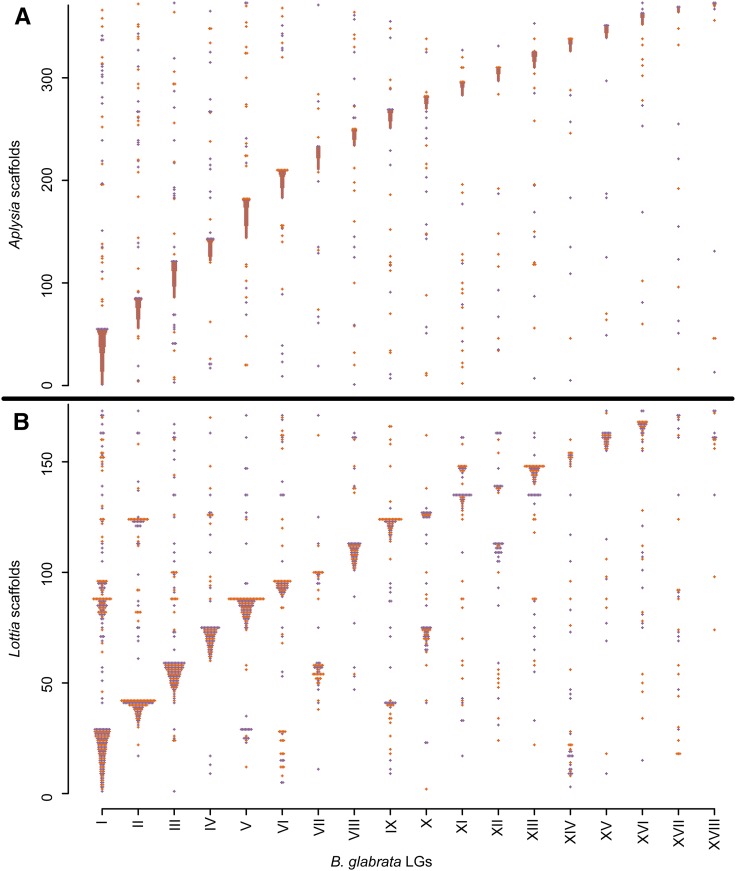
Figure 6.
Synteny comparisons with other gastropods. Scaffolds from A. californica (A) and L. gigantea (B) are plotted along the y-axis (scale = count of scaffolds). Each ortholog to a mapped B. glabrata gene is plotted along the x-axis, in the column corresponding to the B. glabrata core LG. Colors alternate for ease of visualization. Most scaffolds match a single B. glabrata core LG that contains the majority of orthologs. Unlike A. californica, the more distantly-related L. gigantea has several scaffolds that tend to be shared between the same two B. glabrata LGs, likely indicating chromosomal rearrangements. LGs, linkage groups.

